This is an article about the Splunk Web Interface.
1. Introduction
Splunk is a software for searching, monitoring, and analyzing machine generated data. It provides a web interface which can import data from various sources, search events, and generate graphs and reports from the searching results.
In this example, I will demonstrate:
- Install Splunk in a docker container
- Upload a data from a file
- Search events
- Analyze data
2. Technologies Used
The example in this article was built and run using:
- Docker 19.03.8
- Splunk 8.1.1
- Google Chrome 87.0.4280.88
3. Install Splunk to a Docker Container
Assuming your Windows PC already installed Docker. If not, you can install Docker by following my other article. Splunk also provides the Docker commands to deploy Splunk.
3.1 Download
In this step, I will use the following command to pull the latest Splunk image from the Docker hub.
pull
docker pull splunk/splunk:latest
Here is the output from my PC:
pull output
PS C:\MaryZheng\DockerImages> docker pull splunk/splunk:latest
latest: Pulling from splunk/splunk
e96e3a1df3b2: Pull complete                                                                                             1b99828eddf5: Pull complete                                                                                             242dc7e8ea6e: Pull complete                                                                                             8410144f7e54: Pull complete                                                                                             9e363777be4d: Pull complete                                                                                             788319cc8b91: Pull complete                                                                                             4f2ed98ea937: Pull complete                                                                                             ab6f56f420d2: Pull complete                                                                                             604b1fd4b8a1: Pull complete                                                                                             c18fc60d31c1: Pull complete                                                                                             f74a88f112d9: Pull complete                                                                                             Digest: sha256:f0f061d35795548842b212a5704f2c621c886a5e3b6d5d9ec415937cf6a80e5f
Status: Downloaded newer image for splunk/splunk:latest
docker.io/splunk/splunk:latest
PS C:\MaryZheng\DockerImages>
3.2 Start Splunk
In this step, I will start the Splunk with the following command:
run
docker run -d -p 8000:8000 -e SPLUNK_START_ARGS='--accept-license' -e SPLUNK_PASSWORD='pwd123456' splunk/splunk:latest
Note: the password will be used to login in to the Splunk Web interface. Here is the output from my PC:
run output
PS C:\MaryZheng\DockerImages> docker run -d -p 8000:8000 -e SPLUNK_START_ARGS='--accept-license' -e SPLUNK_PASSWORD='pwd123456' splunk/splunk:latest
0538d41aa65c879e4913288d249a05f840286fdce8416864aa71b1a6d896bf4b
PS C:\MaryZheng\DockerImages>
Use the ps command to find the container id. Note: the container id will be different from my example to yours.
PS C:\MaryZheng\DockerImages> docker ps
CONTAINER ID        IMAGE                  COMMAND                  CREATED             STATUS                   PORTS                                                                           NAMES
0538d41aa65c        splunk/splunk:latest   "/sbin/entrypoint.sh…"   2 minutes ago       Up 2 minutes (healthy)   8065/tcp, 8088-8089/tcp, 8191/tcp, 9887/tcp, 0.0.0.0:8000->8000/tcp, 9997/tcp   relaxed_merkle
PS C:\MaryZheng\DockerImages>
Use the following command to forward the port between container and host.
ps -a -f output
PS C:\MaryZheng\DockerImages> docker ps -a -f id=0538d41aa65c
CONTAINER ID        IMAGE                  COMMAND                  CREATED              STATUS                                 PORTS                                                                           NAMES
0538d41aa65c        splunk/splunk:latest   "/sbin/entrypoint.sh…"   About a minute ago   Up About a minute (health: starting)   8065/tcp, 8088-8089/tcp, 8191/tcp, 9887/tcp, 0.0.0.0:8000->8000/tcp, 9997/tcp   great_noyce
PS C:\MaryZheng\DockerImages>
4. Splunk Login Page
Confirm the container is running and launch a web browser and navigate to http://localhost:8000/. You should see the Splunk login page as the following screenshot:
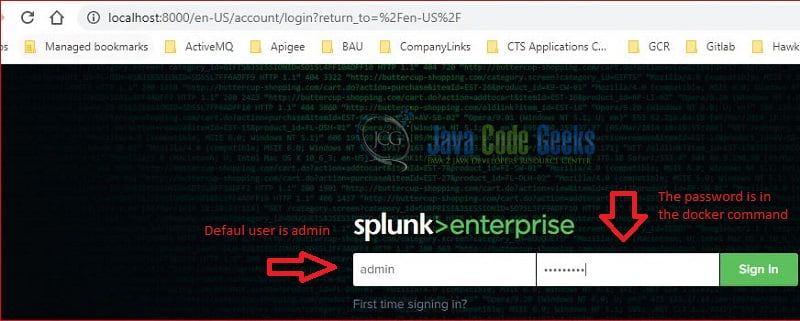
The default user is “admin”, the password is the value you set in the Docker run command.
5. Splunk Landing Page
You should see the landing page after login successfully:
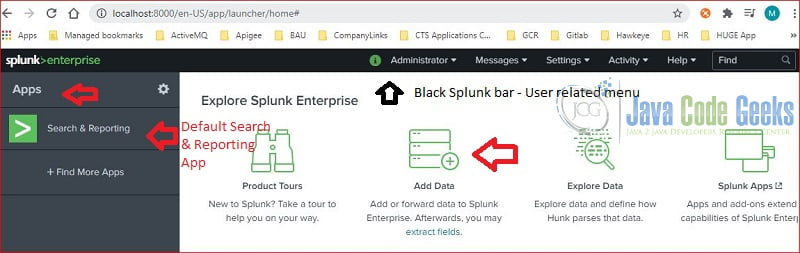
The Splunk landing page has three sections:
- Top black Splunk bar – contains user related menu. The options may vary based on the user’s permissions.
- Left Application bar – contains installed applications. The “Search & Reporting” is the default application.
- Content panel – contains menu items. I will use the “Add Data” button to upload testing data.
5.1 Upload data
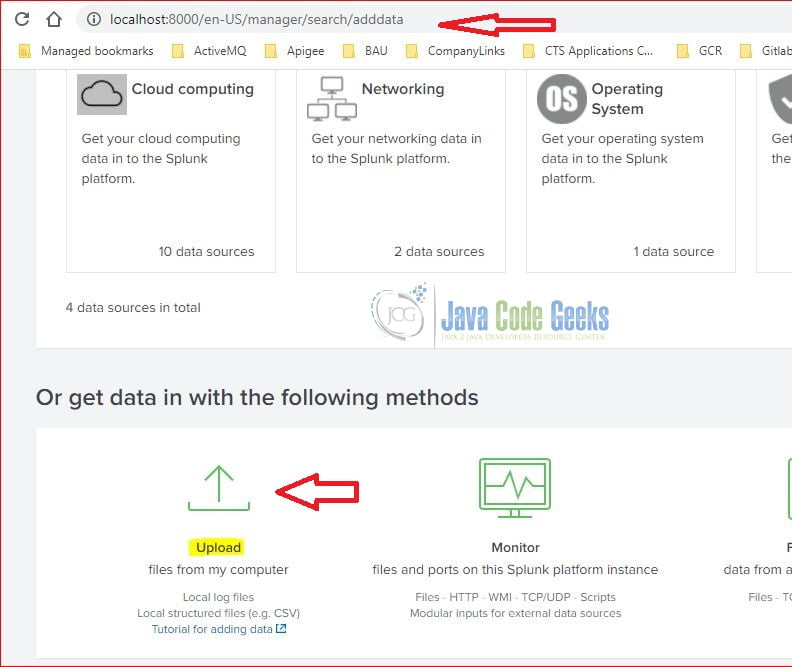
In this step, I click the “Add Data” button which pops up the following screen. I will then chose the “Upload” button to load a file.
Splunk web interface provides an easy-to-understand flow to guide the steps. User can click the green “Next” button to complete each step.
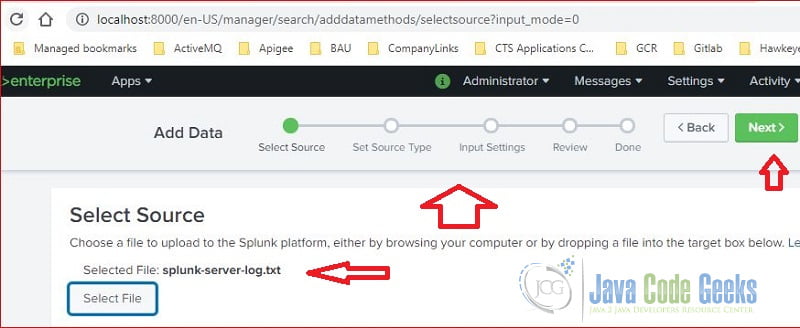
As you seen at Figure 4, it’s at the “Select Source” step, the selected file is splunk-server-log.txt.
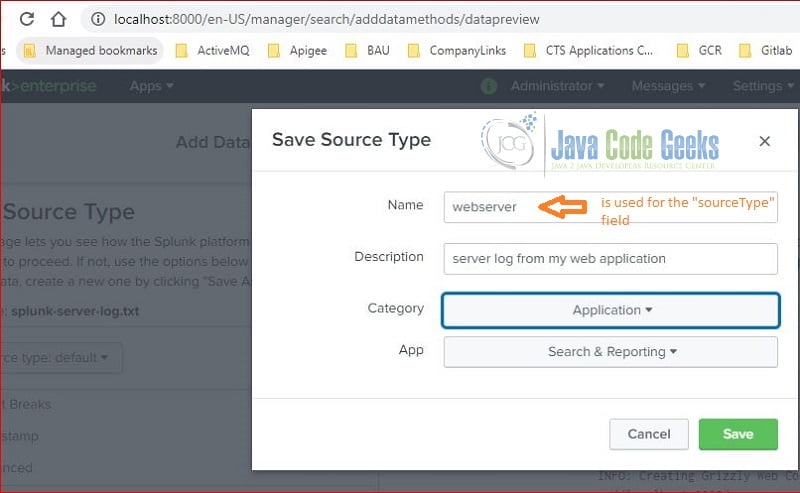
As you seen at Figure 5, the sourceType field is set as webserver.

Figure 6 shows the host field value is maryzhengHost.
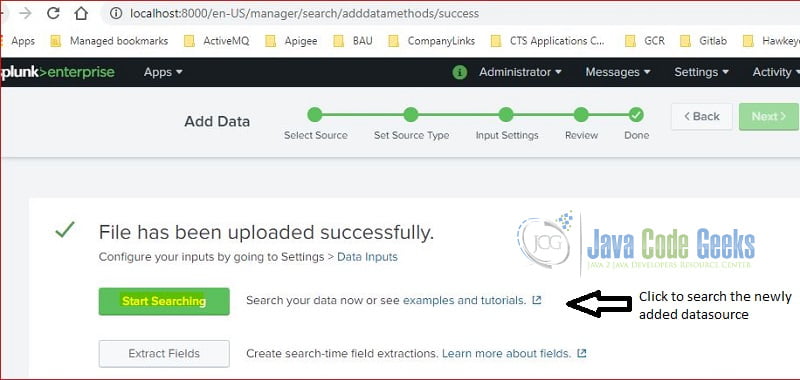
At this step, the upload action is completed successfully. I will click the “Start Searching” button to search events from the loaded file.
Note: I repeated this step to load a csv data file.
6. Search & Reporting App
The Search & Reporting application is installed during Splunk installation. The following screenshot is the initial searching page after the figure 7. It contains the searching terms with the predefined fields.
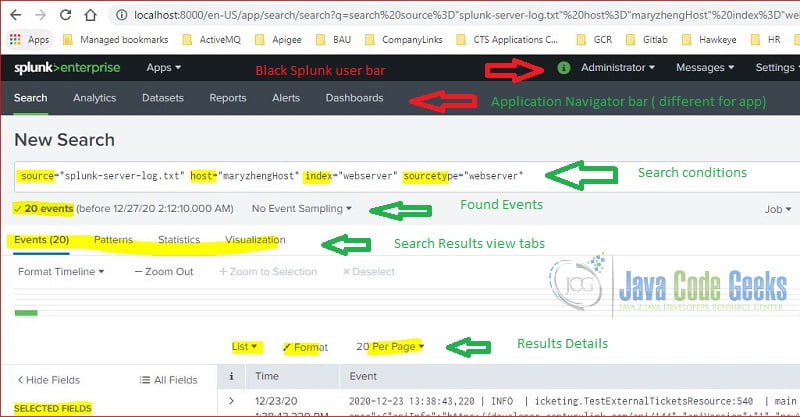
The page has several sections:
- Top black Splunk bar – shows user related menu.
- Application Navigator Bar – shows the default searching application and a button to install application.
- Search term section – includes an input text field for searching terms, time range picker, and search button.
- Search result section – includes an overall found events along with tabs which show the data in a different format.
Note:
- The search term input text field is enabled with auto-completion and content suggestion features.
- The time-range-picker provides predefined time ranges to limit the data.
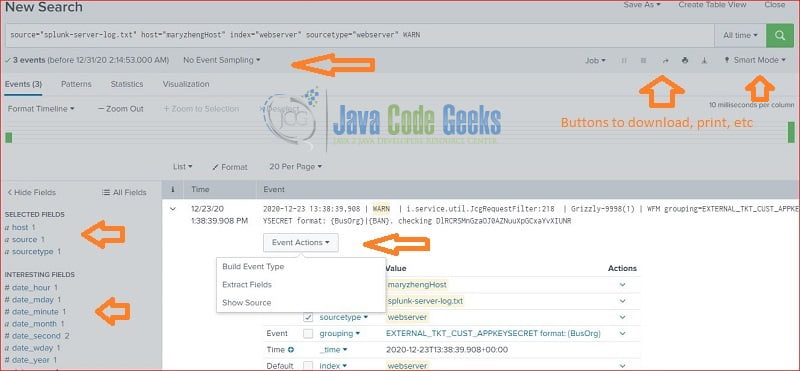
6.1 Fields
Splunk defines several fields: source, sourcetype, index, and host when importing data. It generates interesting fields based on the data during indexing step. It also adds an “Event Action” button to show source, extract fields, etc. User can further analyze data from fields.
6.2 Search History
Splunk web interface provides a “Search history” button to show the history of searching user performed.
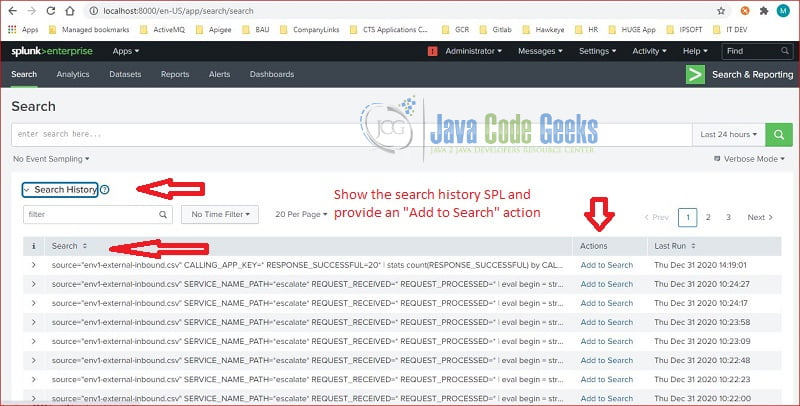
This is a very handy feature. especially the “Add to Search” button.
6.3 Splunk Processing Language
Splunk process language (SPL) defines commands and functions to reduce and transform large amount of data into specific information. In this step, I will show stats and table commands along with max and count functions.
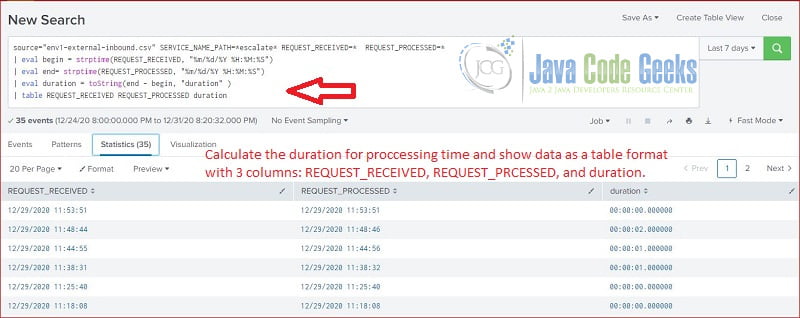
6.3.1 Table Command
Splunk table command returns the searching results in a table format with table fields data. In this step, I will search the raw data and return event received time, processed time, and the execution time in a table format.
table
source="env1-external-inbound.csv"  REQUEST_RECEIVED=*  REQUEST_PROCESSED=*
 SERVICE_NAME_PATH=*escalate*
| eval begin = strptime(REQUEST_RECEIVED, "%m/%d/%Y %H:%M:%S")
| eval end= strptime(REQUEST_PROCESSED, "%m/%d/%Y %H:%M:%S")
| eval duration = toString(end - begin, "duration" )
| table REQUEST_RECEIVED REQUEST_PROCESSED duration
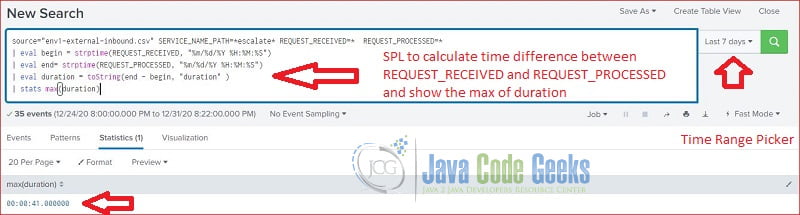
6.3.2 Stats Command
Splunk stats command returns aggregate statistics for a giving field. In this step, I will search the data and calculate the max execution time.
stats max
source="env1-external-inbound.csv" SERVICE_NAME_PATH=*escalate* REQUEST_RECEIVED=*  REQUEST_PROCESSED=*
| eval begin = strptime(REQUEST_RECEIVED, "%m/%d/%Y %H:%M:%S")
| eval end= strptime(REQUEST_PROCESSED, "%m/%d/%Y %H:%M:%S")
| eval duration = toString(end - begin, "duration" )
| stats max(duration)
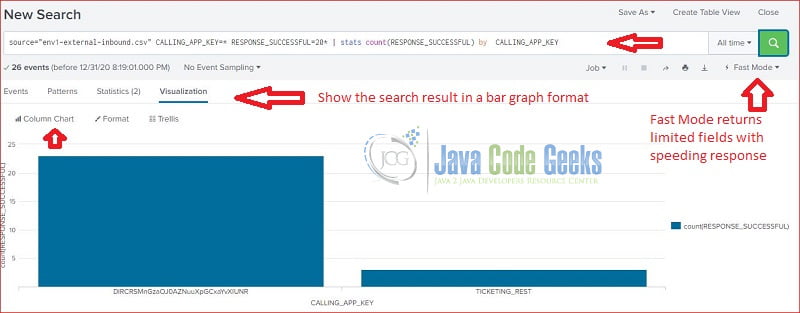
6.3.3 Graph
In this step, I will use the stats command with count function and show the data in a bar graph.
stats count by
source="env1-external-inbound.csv" host="env1" sourcetype="csv" CALLING_APP_KEY=* RESPONSE_SUCCESSFUL=20*
| stats count(RESPONSE_SUCCESSFUL) by  CALLING_APP_KEY
7. Summary
Splunk Web Interface provides lots of features to help importing data, searching interested events, and generating useful information. In this example, I only showed how to import a file, how to search, and analyze the data with Spunk stats and table commands.
8. Download the Scripts
You can download the full source code of this example here: The Splunk Web Interface
