1. Introduction
Splunk is software for searching, monitoring, and analyzing machine-generated data. Analyzing data relies on mathematical statistics data. Splunk provides a transforming stats command to calculate statistical data from events. In this example, I will demonstrate how to use the stats command to calculate the sum and average and find the minimum and maximum values from the events.
2. Technologies Used
The example in this article was built and run using:
- Docker 19.03.8
- Splunk 8.1.1
- Google Chrome 87.0.4280.88
Click my other article to install Splunk.
The Splunk queries in this example are based on the notification-stats.csv data (available in the download section). Please add it by following the Add Data step. Here are a few rows of data as a quick reference.
| Year | Month | ACTION | AVG_IN_SECONDS | MIN_IN_SECONDS | MAX_IN_SECONDS | TOTAL_TRANSACTION |
| 2021 | 1 | Cancel | 61.422 | 2 | 7083 | 391 |
| 2021 | 1 | Complete | 51.4 | 2 | 11080 | 6672 |
| 2021 | 2 | Modified | 279.533 | 6 | 95009 | 568 |
| 2021 | 3 | Rescheduled | 60.226 | 5 | 1902 | 261 |
3. Aggregate Functions
Splunk provides aggregate functions to summarize the values from each event to create a single value. Here are the common aggregate functions provided by Splunk which will be used in the stats command.
| Function | Description | Note |
| avg(<value>) | calculates the average of the values for the given field | the field value must be a number |
| sum(<value>) | calculates the total value for the given field | the field value must be a number |
| count(<value> or c(<value>) | returns the number of occurrences for the field | the filed value can be a string literal value |
| distinct_count(<value> or dc(<value>) | returns the count of distinct values for the field | the filed value can be a string literal value |
| max(<value>) | returns the maximum value of the field | process field as number if possible, otherwise as string using lexicographical ordering |
| min(<value>) | returns the minimum value of the field | process field as number if possible, otherwise as string using lexicographical ordering |
4. Stats Command
4.1 Syntax
Splunk defines the stats command syntax as the following:
stats [allnum=boolean][delim=”string”][partitions=num aggregation [by-clause][span=time-span]
Note: the boldfaces are required.
4.2 Count Example
In this step, I will demonstrate how to use the count function.
It returns a single value for the total occurrence of a giving field when without a by-clause.
stats count(action)
source="notification-stats.csv" host="mary" sourcetype="csv"
|  stats count(action), dc(action) as distinct_action
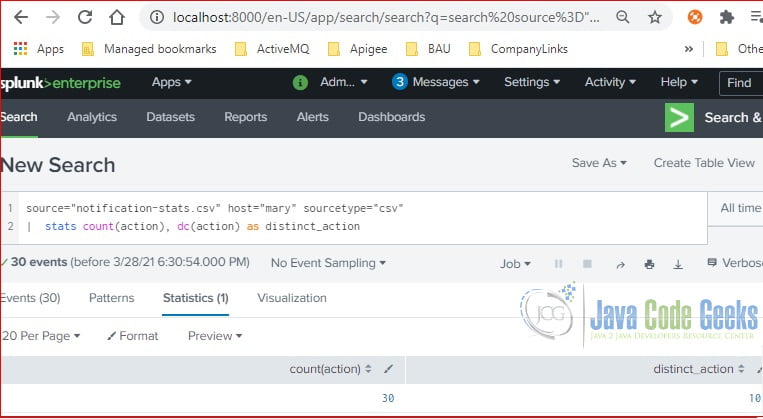
As you seen at Figure 1, the stats count command without a By-clause provides a single value for each count function. There are total 10 distinct action values in the raw event.
The stats count by command returns a list of values. One occurrence count for each unique value of the giving field.
stats count by action
source="notification-stats.csv" host="mary" sourcetype="csv"
|  stats count by action
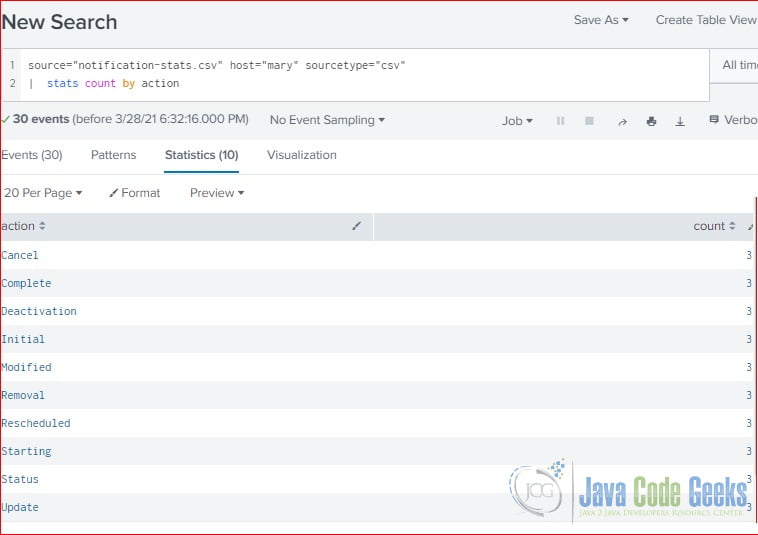
As you seen at Figure 2, the stats count by provides ten row, one count for each unique action.
4.3 Sum Example
In this step, I will demonstrate how to sum the value with the stats sum command.
This following command sums the TOTAL_TRANSACTION by action.
stats sum(TOTAL_TRANSCTION) by action
source="notification-stats.csv" host="mary" sourcetype="csv"
|  stats sum(TOTAL_TRANSACTION) by action
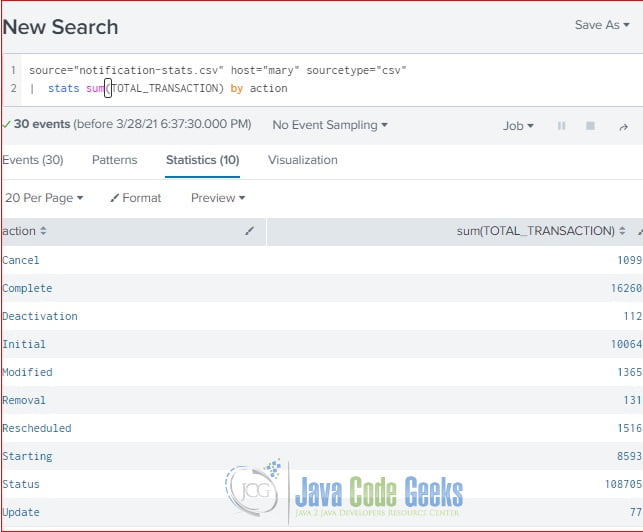
As you seen at Figure 3, it sums up the TOTAL_TRANSACTION value by the action value. It returns ten rows of data.
The following command sums the TOTAL_TRANSACTION value by year and month.
stats sum(TOTAL_TRANSACTION) by year, month
source="notification-stats.csv" host="mary" sourcetype="csv"
|  stats sum(TOTAL_TRANSACTION) by year ,month
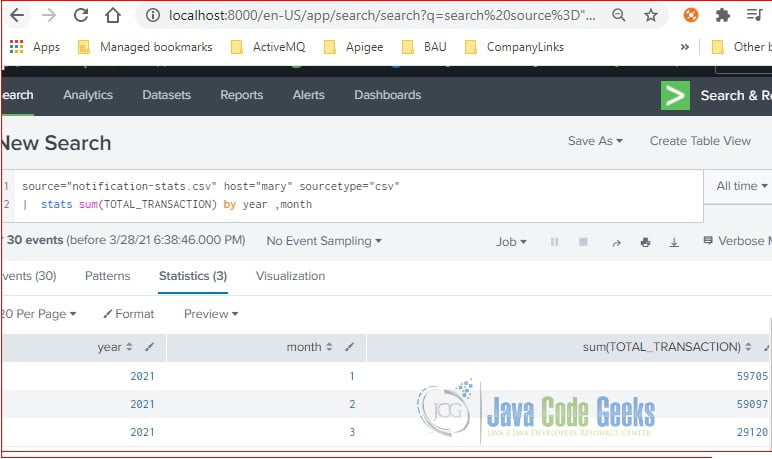
As you seen at Figure 4, it sums up the TOTAL_TRANSACTION by YEAR and MONTH. It returns three rows of data.
4.4 Min, Max, and Average Examples
In this step, I will demonstrate how to find the minimum, maximum, and average value with the stats command.
stats min(TOTAL_TRANSACTION), max(TOTAL_TRANSACTION), avg(TOTAL_TRANSACTION) by action
source="notification-stats.csv" host="mary" sourcetype="csv"
|  stats min(TOTAL_TRANSACTION), max(TOTAL_TRANSACTION), avg(TOTAL_TRANSACTION) by action
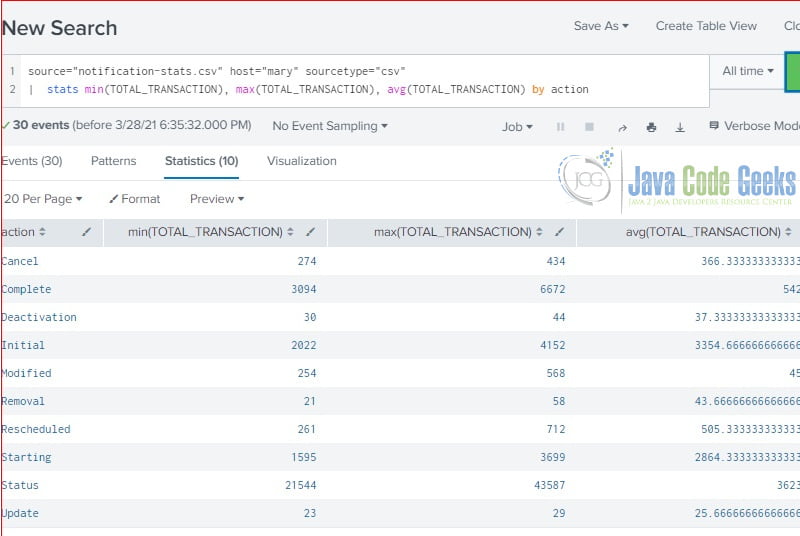
It returns ten rows of data, one for each unique action.
5. Summary
In this article, I demonstrated how to use the stats command to get meaningful statistical data out of Splunk raw events. There are other aggregate functions that Splunk provided which can be used in the stats command. Please reference Splunk documentation for more details.
6. Download the Source Code
You can download the full source code of this example here: Splunk Stats Command Example
