Welcome, in this tutorial, we will see how to implement Prometheus in a Spring Boot application.
1. Introduction
Before going further in this tutorial, we will look at the common terminology such as introduction to Spring Boot and Prometheus.
1.1 Spring Boot
- Spring boot is a module that provides rapid application development feature to the spring framework including auto-configuration, standalone-code, and production-ready code
- It creates applications that are packaged as jar and are directly started using embedded servlet container (such as Tomcat, Jetty or, Undertow). Thus, no need to deploy the war files
- It simplifies the maven configuration by providing the starter template and helps to resolve the dependency conflicts. It automatically identifies the required dependencies and imports them into the application
- It helps in removing the boilerplate code, extra annotations, and XML configurations
- It provides powerful batch processing and manages the rest endpoints
- It provides an efficient JPA-starter library to effectively connect the application with the relational databases
- It offers a Microservice architecture and cloud configuration that manages all the application related configuration properties in a centralized manner
1.2 Prometheus
- It is an open-source monitoring tool that stores the metric data in a time-series database by periodically pulling it via the HTTP
- It consists of 3 components –
- A data scraper that periodically pulls the metrics data via the HTTP
- A time-series database to store the metrics data
- A simple graphical user interface to see, query, and monitor the metrics
- To configure Prometheus and more precisely the scrape interval, the targets, etc you’ll need to configure an external
prometheus.ymlfile
Let us go ahead with the tutorial implementation but before going any further I’m assuming that you’re aware of the Spring boot basics and have read the Spring boot health check tutorial available at this link.
2. Spring Boot Application with Prometheus
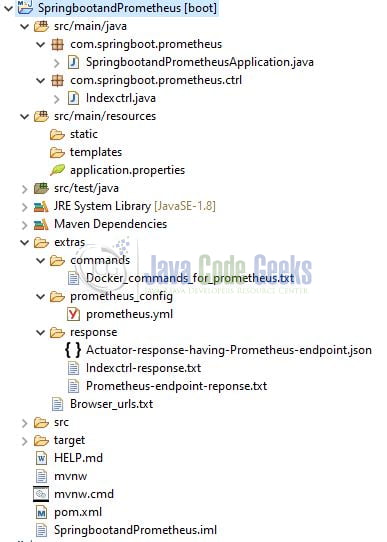
2.1 Tools Used for Spring boot application and Project Structure
We are using Eclipse Kepler SR2, JDK 8, and Maven. In case you’re confused about where you should create the corresponding files or folder, let us review the project structure of the spring boot application.
Let us start building the application!
3. Creating a Spring Boot application
Below are the steps involved in developing the application.
3.1 Maven Dependency
Here, we specify the dependency for the Spring Boot (Web and Actuator) and Prometheus. Maven will automatically resolve the other dependencies. The updated file will have the following code.
pom.xml
|
01
02
03
04
05
06
07
08
09
10
11
12
13
14
15
16
17
18
19
20
21
22
23
24
25
26
27
28
29
30
31
32
33
34
35
36
37
38
39
40
41
42
43
44
45
46
47
48
49
50
51
52
53
54
55
56
57
58
|
<?xml version="1.0" encoding="UTF-8"?> xsi:schemaLocation="http://maven.apache.org/POM/4.0.0 https://maven.apache.org/xsd/maven-4.0.0.xsd"> <modelVersion>4.0.0</modelVersion> <parent> <groupId>org.springframework.boot</groupId> <artifactId>spring-boot-starter-parent</artifactId> <version>2.4.0</version> <relativePath /> <!-- lookup parent from repository --> </parent> <groupId>com.springboot.prometheus</groupId> <artifactId>SpringbootandPrometheus</artifactId> <version>0.0.1-SNAPSHOT</version> <name>SpringbootandPrometheus</name> <description>Spring boot and prometheus</description> <properties> <java.version>1.8</java.version> </properties> <dependencies> <dependency> <groupId>org.springframework.boot</groupId> <artifactId>spring-boot-starter-actuator</artifactId> </dependency> <dependency> <groupId>org.springframework.boot</groupId> <artifactId>spring-boot-starter-web</artifactId> </dependency> <!-- Micrometer Prometheus registry --> <!-- spring boot will automatically configure the PrometheusMeterRegistry and CollectorRegistry to collect and export metrics data in a format that can be scraped by a Prometheus server --> <dependency> <groupId>io.micrometer</groupId> <artifactId>micrometer-registry-prometheus</artifactId> <scope>runtime</scope> </dependency> <dependency> <groupId>org.springframework.boot</groupId> <artifactId>spring-boot-starter-test</artifactId> <scope>test</scope> </dependency> </dependencies> <build> <plugins> <!-- to make the application as fat jar so that spring boot libraries are included --> <plugin> <groupId>org.springframework.boot</groupId> <artifactId>spring-boot-maven-plugin</artifactId> </plugin> </plugins> </build></project> |
3.2 Application Properties
Create a new properties file at the location: SpringbootandPrometheus/src/main/resources/ and add the following code to it. Here we will define the application and actuator configuration.
application. properties
|
01
02
03
04
05
06
07
08
09
10
|
# Application configuration.## You can change the server port configuration.server.port=10095# Management configuration## You can change the management port configuration.## Note - Will be used by the actuator endpoint.management.server.port=9091## Property to expose all end points (both sensitive and non-sensitive)## By default only "health" and "info" endpoints are enabled.management.endpoints.web.exposure.include=info,health,prometheus |
3.3 Java Classes
Let us write all the java class(es) involved in this application. Remember as this tutorial is purely on Prometheus configuration so we will just create the main class (required for application startup).
3.3.1 Implementation/Main class
Add the following code to the main class to bootstrap the application from the main method. Always remember, the entry point of the spring boot application is the class containing @SpringBootApplication annotation and the static main method.
SpringbootandPrometheusApplication.java
|
01
02
03
04
05
06
07
08
09
10
11
12
13
14
15
16
17
18
|
package com.springboot.prometheus;import org.slf4j.Logger;import org.slf4j.LoggerFactory;import org.springframework.boot.SpringApplication;import org.springframework.boot.autoconfigure.SpringBootApplication;@SpringBootApplicationpublic class SpringbootandPrometheusApplication { private static final Logger LOGGER = LoggerFactory.getLogger(SpringbootandPrometheusApplication.class); public static void main(String[] args) { SpringApplication.run(SpringbootandPrometheusApplication.class, args); LOGGER.info("Springboot and Prometheus application is started successfully."); }} |
3.4 Prometheus on Docker
To run the Prometheus server in a docker container we need a configuration YAML file i.e. prometheus.yml and this place can be placed anywhere in your machine.
prometheus.yml
|
01
02
03
04
05
06
07
08
09
10
11
12
13
14
15
16
17
18
19
20
21
|
# my global configglobal: # how frequently to scrape targets. default is 1 minute scrape_interval: 10sscrape_configs: # the job name is assigned to scraped metrics by default - job_name: spring_prometheus # the HTTP resource path on which to fetch metrics from targets metrics_path: /actuator/prometheus # how frequently to scrape targets from this job scrape_interval: 5s # a static_config allows specifying a list of targets and a common label set for them static_configs: # HOST_IP is the host_ip_address. make sure to replace it with the IP address of your machine # where spring boot application is running. Note that localhost won't work here as we will be # connecting to the host machine from the docker container. you must specify the network IP address. # to check system IP you can run ipconfig or ifconfig in your terminal, depending on your os. # 9091 represents the port number on which the actuator endpoint is exposed. refer application.properties for info. - targets: - 'HOST_IP:9091' |
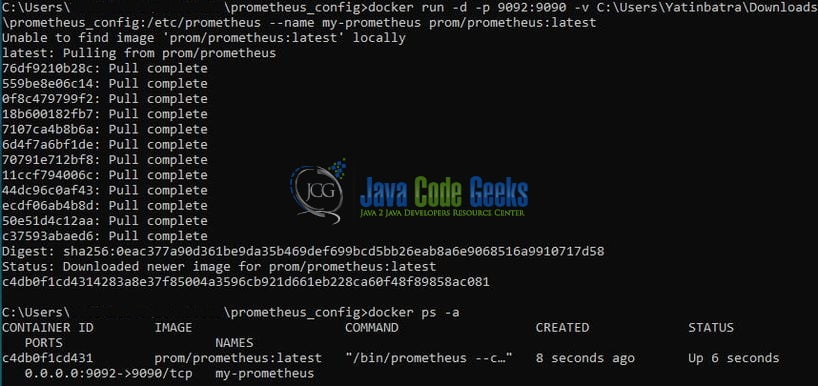
Once the file is prepared you are ready to run the Prometheus on docker. You can execute the below commands to get the Prometheus server running on the docker container in minutes.
Docker Commands
|
1
2
3
4
5
|
-- command to run prometheus on dockerdocker run -d -p 9092:9090 -v :/etc/prometheus --name my-prometheus prom/prometheus:latest-- command to check if the prometheus docker container is started successfully or notdocker ps -a |
If everything goes well the container would be started successfully as shown in Fig. 2.
To see the Prometheus dashboard navigate the browser to the following URL – http://localhost:9092
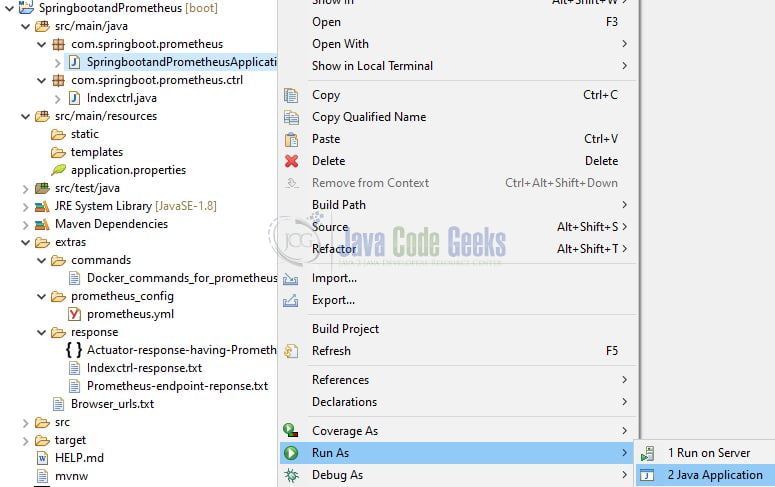
4. Run the Application
To execute the application, right-click on the SpringbootandPrometheusApplication.java class, Run As -> Java Application.
5. Project Demo
When the application is started, the prometheus endpoint is exposed by the spring boot actuator when micrometer-registry-prometheus is added to the classpath. The endpoint will be available at the following URL – {{protocol}}://{{baseUrl}}:{{portNumber}}/actuator/prometheus. For this tutorial, you can access the URL at – http://localhost:9091/actuator/prometheus. This endpoint exposes the metric data in a format that can be read by the Prometheus server.
Prometheus endpoint response
|
01
02
03
04
05
06
07
08
09
10
11
12
13
14
15
16
17
18
19
20
21
22
|
# HELP tomcat_sessions_active_current_sessions # TYPE tomcat_sessions_active_current_sessions gaugetomcat_sessions_active_current_sessions 0.0# HELP jvm_memory_used_bytes The amount of used memory# TYPE jvm_memory_used_bytes gaugejvm_memory_used_bytes{area="heap",id="PS Survivor Space",} 0.0jvm_memory_used_bytes{area="heap",id="PS Old Gen",} 1.6091328E7jvm_memory_used_bytes{area="heap",id="PS Eden Space",} 2.386132E7jvm_memory_used_bytes{area="nonheap",id="Metaspace",} 3.5412864E7jvm_memory_used_bytes{area="nonheap",id="Code Cache",} 7344000.0jvm_memory_used_bytes{area="nonheap",id="Compressed Class Space",} 4857912.0# HELP jvm_threads_states_threads The current number of threads having NEW state# TYPE jvm_threads_states_threads gaugejvm_threads_states_threads{state="runnable",} 14.0jvm_threads_states_threads{state="blocked",} 0.0jvm_threads_states_threads{state="waiting",} 23.0jvm_threads_states_threads{state="timed-waiting",} 8.0jvm_threads_states_threads{state="new",} 0.0jvm_threads_states_threads{state="terminated",} 0.0## More data ...... (omitted for brevity) |
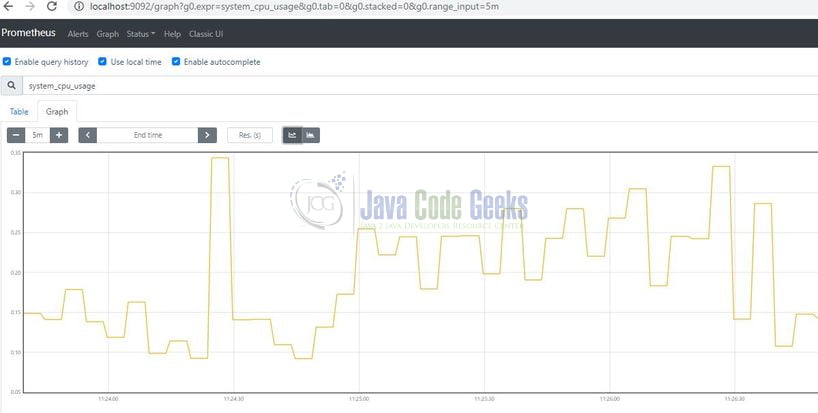
6. See Spring boot metrics from Prometheus dashboard
Navigate the Prometheus dashboard at the following URL – http://localhost:9092 in the browser and enter the query expression inside the Expression text field and see all the metrics for that query. Following is an example of a Prometheus graph for the System CPU usage metric for our spring boot application.
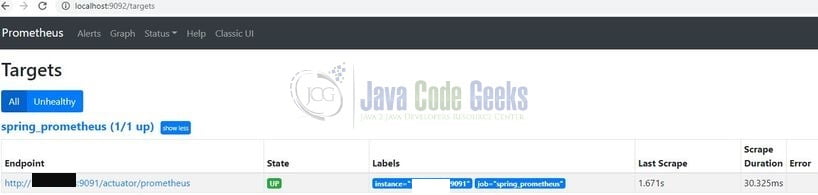
Similarly, you can generate different metrics for our spring boot application. Learn more about the Prometheus query expression at this link. Also, to check if the Prometheus is correctly listening to our spring boot application you can navigate to Status -> Targets in the top navigation bar.
That is all for this tutorial and I hope the article served you whatever you were looking for. Happy Learning and do not forget to share!
7. Summary
In this section, you learned,
- Spring boot and Prometheus introduction
- Steps to implement the Prometheus configuration in Spring Boot and Docker
You can download the sample application as an Eclipse project in the Downloads section.
8. Download the Project
This was an example of implementing Prometheus in a Spring Boot application.
You can download the full source code of this example here: Spring Boot Application with Prometheus
