In this article, we will explain Dashboards in Splunk.
1. Introduction
Splunk is software for searching, monitoring, and analyzing machine-generated data. It provides a web interface to create dashboards. In this example, I will demonstrate:
- How to create a dashboard from scratch
- How to create a dashboard from a search result
- How to create a dashboard from a report
- How to create a dashboard from a source file
- How to edit, clone, and delete a dashboard
2. Technologies Used
The example in this article was built and run using:
- Docker 19.03.8
- Splunk 8.1.1
- Google Chrome 87.0.4280.88
Click my other article to install Splunk.
3. Create a Dashboard in Splunk
Splunk provides dashboard documentation. In this step, I will show step-by-step instructions along with screenshots when creating a dashboard.
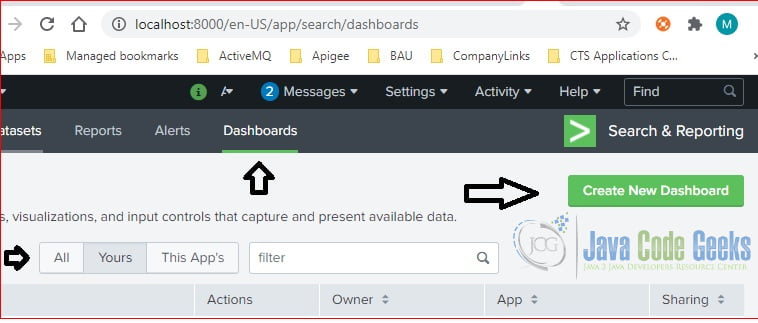
3.1 Create New Dashboard
Click the “Create New Dashboard” button under the Dashboards section.
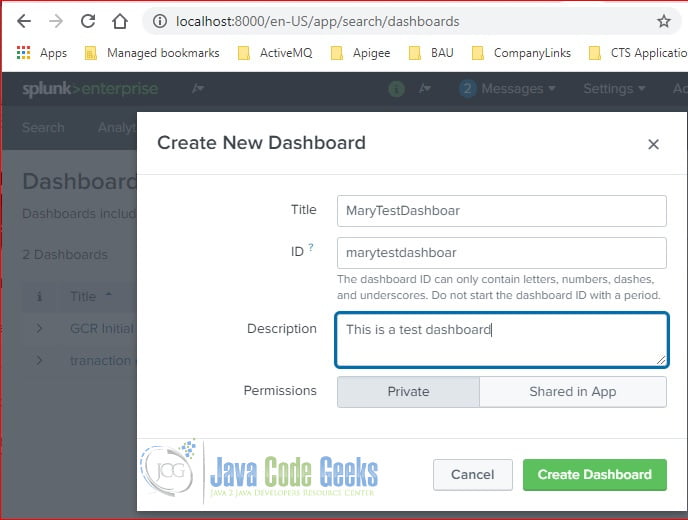
3.2 Enter Dashboard Title
In the pop up window, enter the dashboard’s Title and Description. Then click the “Create Dashboard” button.
3.3 Edit Dashboard
It displays the “Edit Dashboard” page.
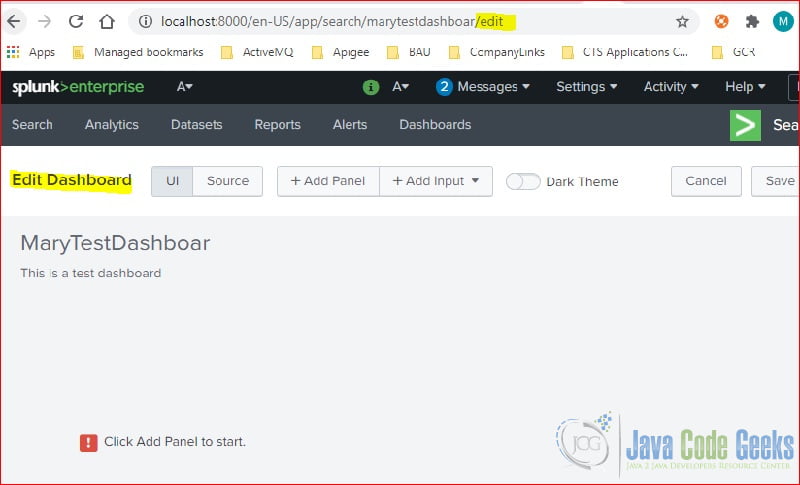
3.4 Add Panel
There are two ways to edit a dashboard: UI or Source. In this step, I will use the default UI option and click the +Add Panel button.
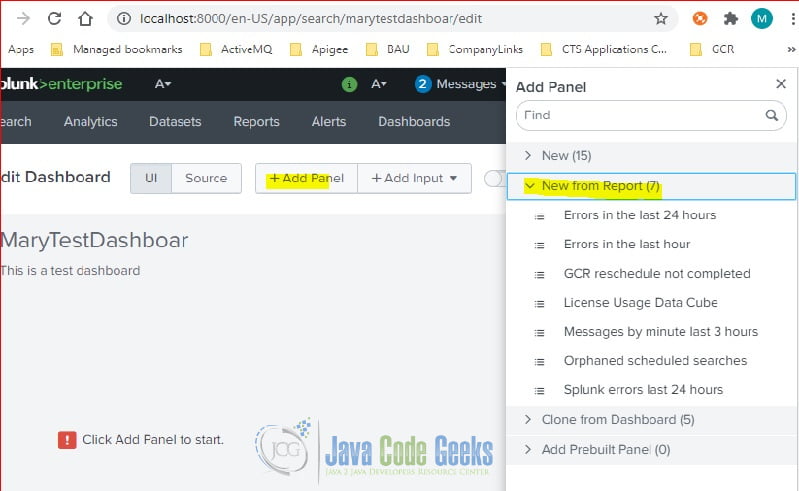
It displays four categories to add a panel. In this step, I will expand “New from Report“.
3.5 Add Panel from Report
In this step, I will add a panel from the “GCR reschedule not completed” report. It will show “Preview” along with the Search String. Click “Add to Dashboard“.
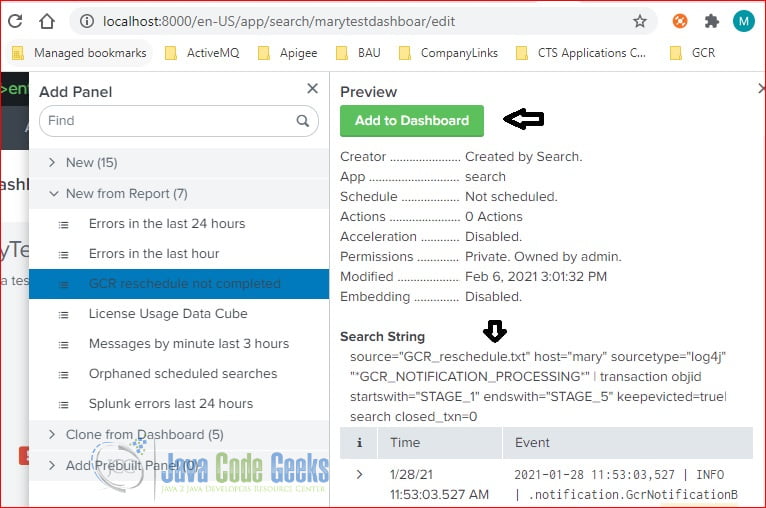
Click Save to save the dashboard.
3.6 Add Input
Click “+Add Input” to add desired inputs to the dashboard.
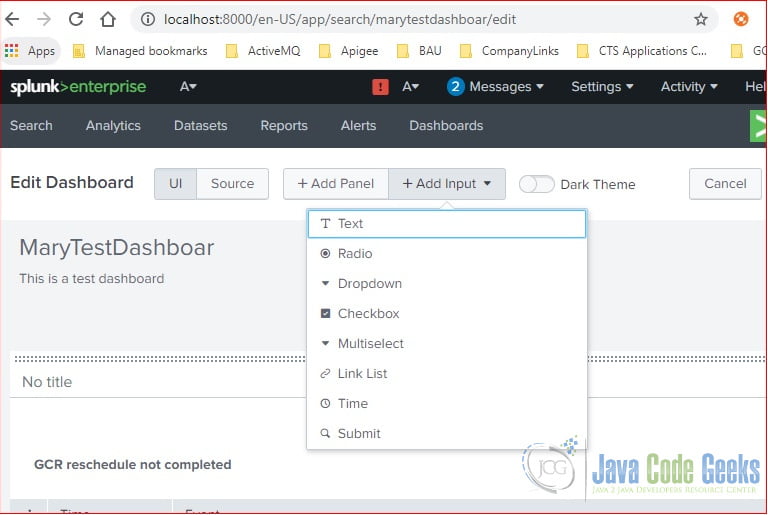
Reference my other article on how to add a Time input. Reference Splunk document for others.
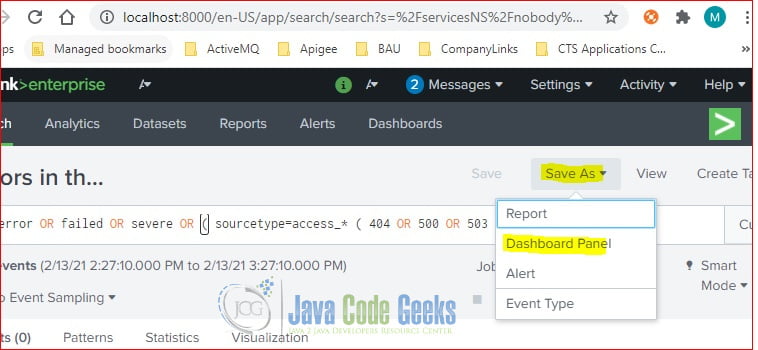
4. Create Dashboard from Search Result
Click “Save As” from search results and select the “Dashboard Panel” option.
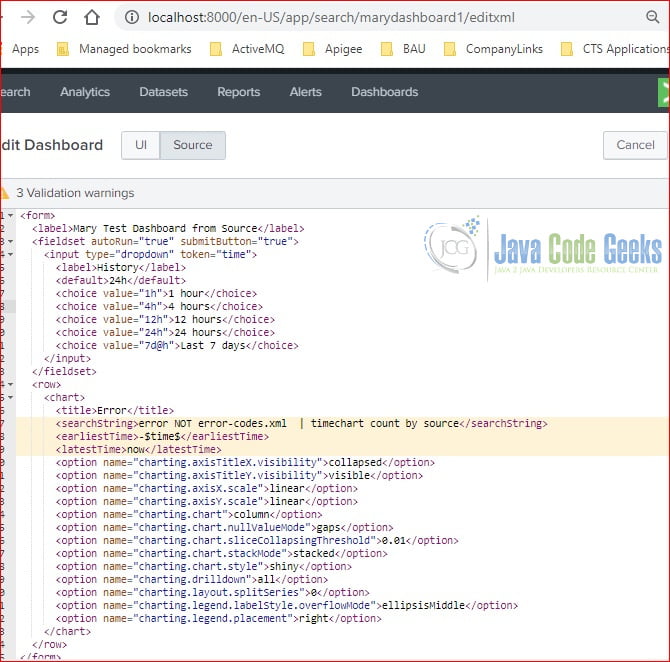
5. Create Dashboard from Source
We can create a dashboard from a XML source file. Click Source and paste the xml.
DashboardSource.xml
<form>
  <label>Mary Test Dashboard from Source</label>
  <fieldset autoRun="true" submitButton="true">
    <input type="dropdown" token="time">
      <label>History</label>
      <default>24h</default>
      <choice value="1h">1 hour</choice>
      <choice value="4h">4 hours</choice>
      <choice value="12h">12 hours</choice>
      <choice value="24h">24 hours</choice>
      <choice value="7d@h">Last 7 days</choice>
    </input>
  </fieldset>
  <row>
    <chart>
      <title>Error</title>
      <searchString>error NOT error-codes.xml  | timechart count by source</searchString>
      <earliestTime>-$time$</earliestTime>
      <latestTime>now</latestTime>
      <option name="charting.axisTitleX.visibility">collapsed</option>
      <option name="charting.axisTitleY.visibility">visible</option>
      <option name="charting.axisX.scale">linear</option>
      <option name="charting.axisY.scale">linear</option>
      <option name="charting.chart">column</option>
      <option name="charting.chart.nullValueMode">gaps</option>
      <option name="charting.chart.sliceCollapsingThreshold">0.01</option>
      <option name="charting.chart.stackMode">stacked</option>
      <option name="charting.chart.style">shiny</option>
      <option name="charting.drilldown">all</option>
      <option name="charting.layout.splitSeries">0</option>
      <option name="charting.legend.labelStyle.overflowMode">ellipsisMiddle</option>
      <option name="charting.legend.placement">right</option>
    </chart>
  </row>
</form>
6. Manage Dashboard
View the dashboard under the Dashboard section. Click the Edit button to display options.
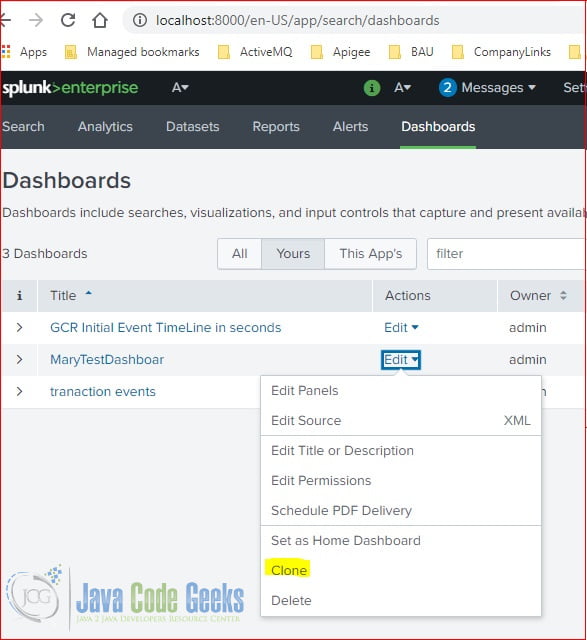
- Select “Delete” to delete the selected dashboard.
- Select “Clone” to create a new dashboard based on the selected dashboard.
- Select “Edit Panels” or “Edit Source” to update the selected dashboard.
- Select “Edit Permissions” to update its permissions
- Select “Schedule PDF Delivery” to schedule a PDF delivery
7. Summary
In this example, I showed how to create a dashboard from the search result, report, another dashboard. I also showed how to edit and delete a dashboard via the Splunk web interface.
8. Download the Source Code
You can download the full source code of this example here: Splunk Dashboards Example
