Splunk Reports Example
In this article, we are going to explain Splunk Reports through examples.
1. Introduction
Splunk is software for searching, monitoring, and analyzing machine-generated data. It provides a web interface to generate reports from the searching results.
In this example, I will demonstrate:
- How to create a report
- How to edit a report
- How to delete a report
2. Technologies Used
The example in this article was built and run using:
- Docker 19.03.8
- Splunk 8.1.1
- Google Chrome 87.0.4280.88
Click my other article to install Splunk.
3. Create a Report
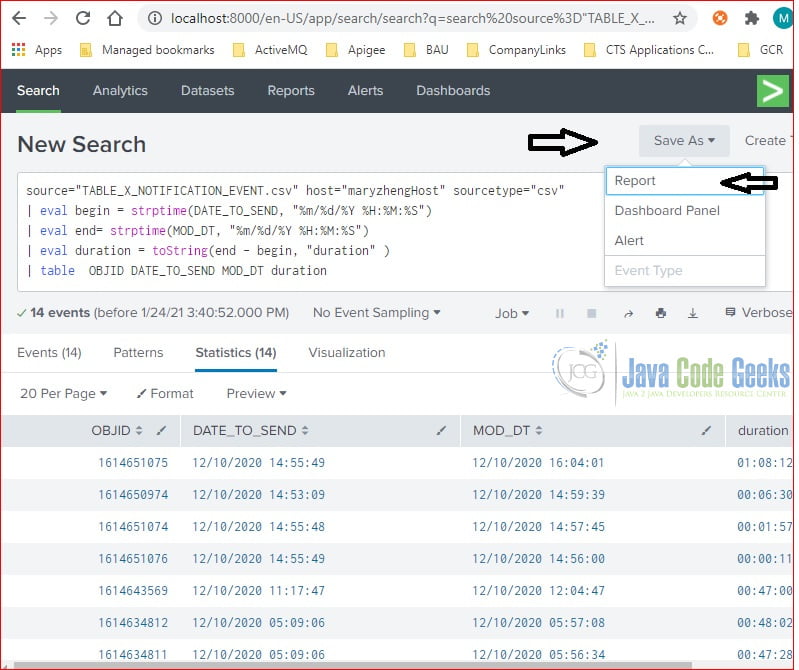
After searching the data, user can click the “Save As” button and then select the “Report” option to generate a report. See the Figure 1 for details.
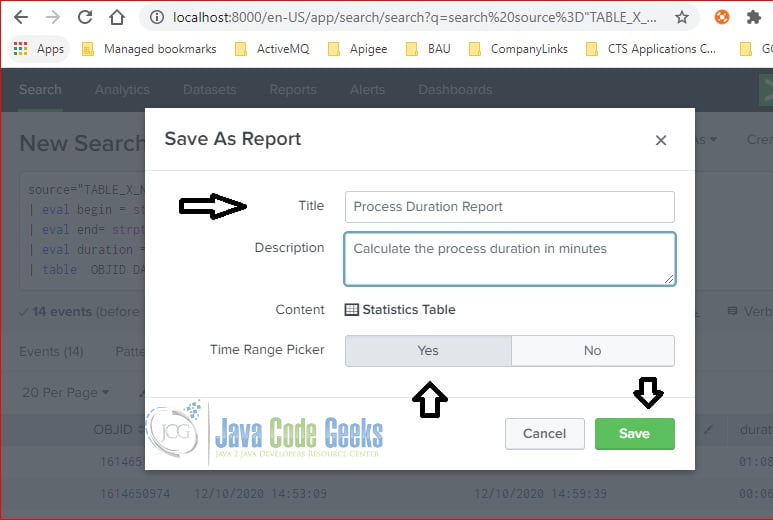
It will pop up a new window, user can enter the report title and select “Yes” for “Time Range Picker”, then click the “Save” button.
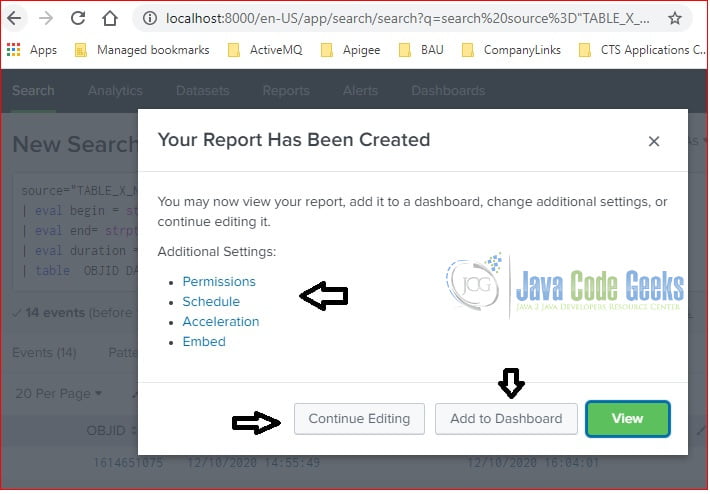
The pop-up page is updated with “Your Report Has Been Created” message. It also has three buttons and four links for Permission, Schedule, Acceleration, and Embed.
A report is created successfully at this step.
4. Edit a Report
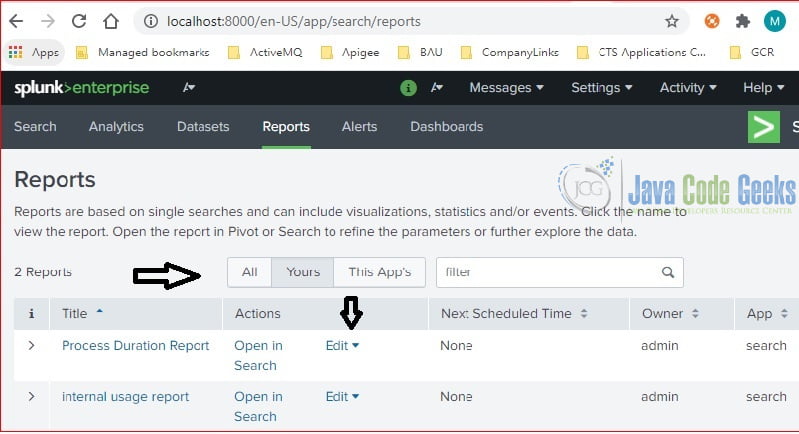
To edit a report, user clicks the Edit link for the selected report.
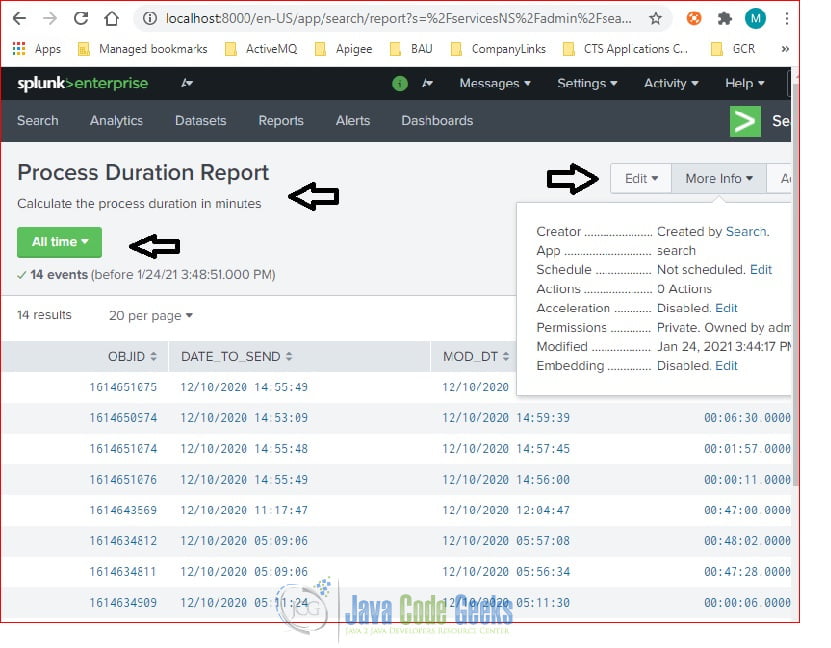
It will display details for the selected report. It has an Edit link and More Info button. Click “More Info” to view additional information for the report. Click “Edit” to update the report.
5. Delete a Report
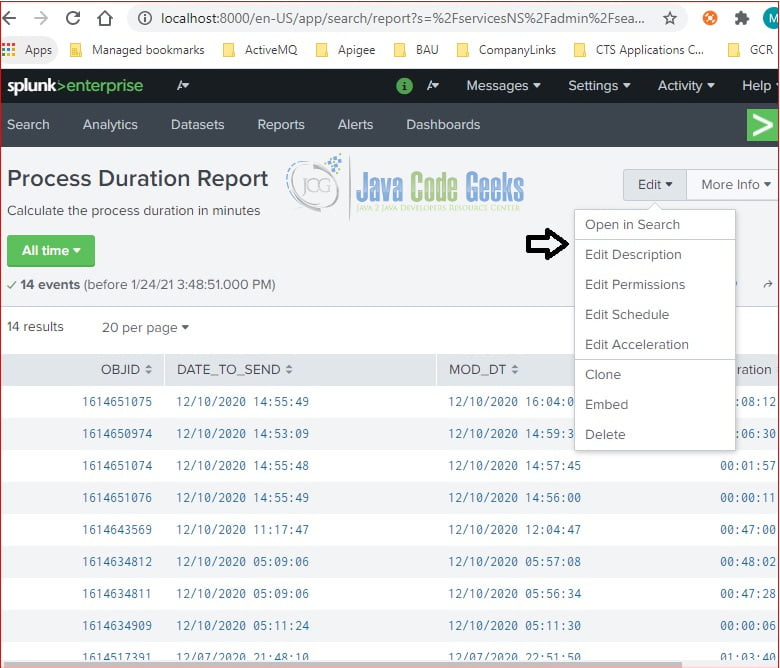
On the report detail page, click on the Edit drop-down button and select the “Delete” option to delete it.
6. Summary
In this example, I showed how to create a report from the searching results. I also showed how to edit and delete a report via the Splunk web interface.

