In this example we will learn about GWT Charts. For GWT charts to work you need Java 1.7 or above.
Tools and technologies used in this example are Java 1.8, Eclipse Luna 4.4.2, Eclipse GWT Plugin 2.6.
1. GWT
GWT is a development toolkit for building and optimizing complex browser-based applications. Its goal is to enable productive development of high-performance web applications without the developer having to be an expert in browser quirks, XMLHttpRequest, and JavaScript. GWT is used by many products at Google, including AdWords, AdSense, Flights, Hotel Finder, Offers, Wallet, Blogger. It’s open source, completely free, and used by thousands of developers around the world.
2. gwt-chart jar
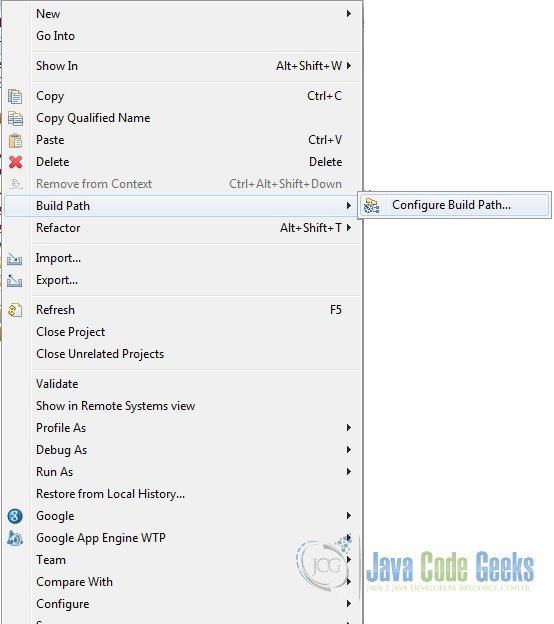
To run this example you need to download the gwt-chart jar and put it in the classpath. You can download the jar file from Maven Repository. Download the jar in your local drive then right click on the project, go to ‘Build Path’ then click ‘Configure Build Path’.
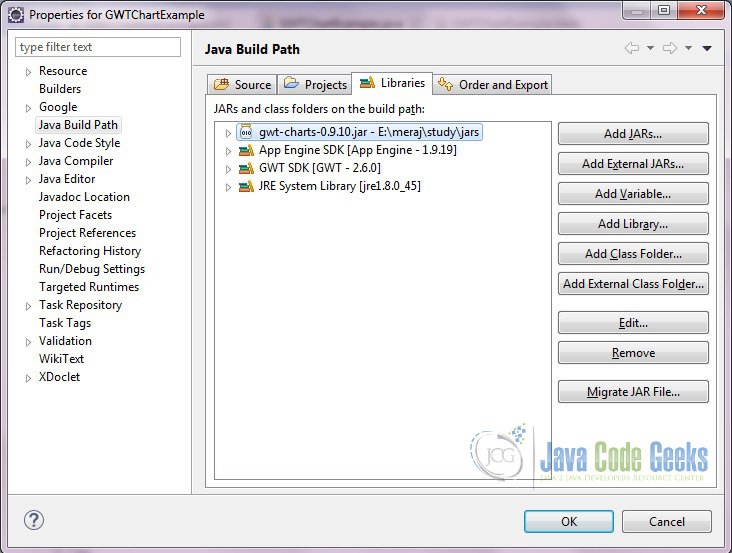
Click on the ‘Add External JARs…‘ then browse to the place where you downloaded the jar. Include this in your library list.
If you are creating a maven project you can define the below dependency.
<dependency>
    <groupId>com.googlecode.gwt-charts</groupId>
    <artifactId>gwt-charts</artifactId>
    <version>0.9.10</version>
</dependency>
3. Project setup
Inherit the module com.googlecode.gwt.charts.Charts in the your XML definition file.
<inherits name="com.googlecode.gwt.charts.Charts"/>
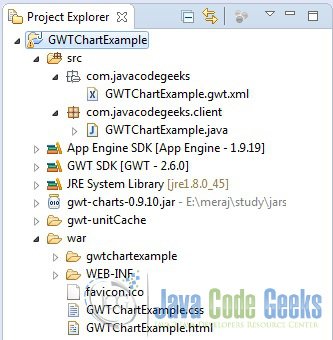
Below is the screenshot of project setup. Important files will be described later.
4. Entry point
Below is the GWTChartExample class which will be called when the application is loaded. This class will implement the com.google.gwt.core.client.EntryPoint and will override the onModuleLoad() method of it. Below is the class snippet.
GWTChartExample.java
package com.javacodegeeks.client;
import com.google.gwt.core.client.EntryPoint;
import com.google.gwt.user.client.Window;
import com.google.gwt.user.client.ui.RootLayoutPanel;
import com.google.gwt.user.client.ui.SimpleLayoutPanel;
import com.google.gwt.user.client.ui.Widget;
import com.googlecode.gwt.charts.client.ChartLoader;
import com.googlecode.gwt.charts.client.ChartPackage;
import com.googlecode.gwt.charts.client.ColumnType;
import com.googlecode.gwt.charts.client.DataTable;
import com.googlecode.gwt.charts.client.corechart.PieChart;
/**
* Entry point classes define <code>onModuleLoad()</code>.
*/
public class GWTChartExample implements EntryPoint {
private SimpleLayoutPanel layoutPanel;
private PieChart pieChart;
/**
* This is the entry point method.
*/
@Override
public void onModuleLoad() {
Window.enableScrolling(false);
Window.setMargin("0px");
RootLayoutPanel.get().add(getSimpleLayoutPanel());
// Create the API Loader
ChartLoader chartLoader = new ChartLoader(ChartPackage.CORECHART);
chartLoader.loadApi(new Runnable() {
@Override
public void run() {
getSimpleLayoutPanel().setWidget(getPieChart());
drawPieChart();
}
});
}
private SimpleLayoutPanel getSimpleLayoutPanel() {
return layoutPanel != null ? layoutPanel : new SimpleLayoutPanel();
}
private Widget getPieChart() {
return pieChart != null ? pieChart : new PieChart();
}
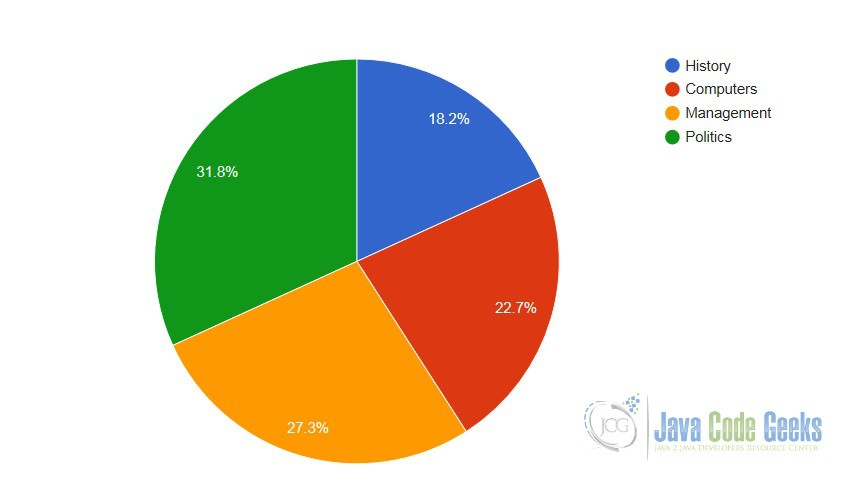
private void drawPieChart() {
// Prepare the data
DataTable dataTable = DataTable.create();
dataTable.addColumn(ColumnType.STRING, "Subject");
dataTable.addColumn(ColumnType.NUMBER, "Number of students");
dataTable.addRows(4);
dataTable.setValue(0, 0, "History");
dataTable.setValue(1, 0, "Computers");
dataTable.setValue(2, 0, "Management");
dataTable.setValue(3, 0, "Politics");
dataTable.setValue(0, 1, 20);
dataTable.setValue(1, 1, 25);
dataTable.setValue(2, 1, 30);
dataTable.setValue(3, 1, 35);
// Draw the chart
pieChart.draw(dataTable);
}
}
Define the entry point in the GWT configuration file as below.

GWTChartExample.gwt.xml
<?xml version="1.0" encoding="UTF-8"?>

<!DOCTYPE module PUBLIC "-//Google Inc.//DTD Google Web Toolkit 2.6.0//EN"
"http://google-web-toolkit.googlecode.com/svn/tags/2.6.0/distro-source/core/src/gwt-module.dtd">
<module rename-to='gwtchartexample'>

<inherits name="com.googlecode.gwt.charts.Charts"/>
<inherits name='com.google.gwt.user.theme.clean.Clean'/>

<entry-point class='com.javacodegeeks.client.GWTChartExample'/>
</module>
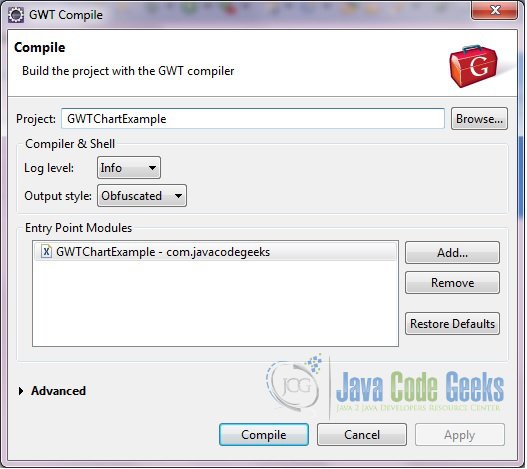
5. GWT Compile
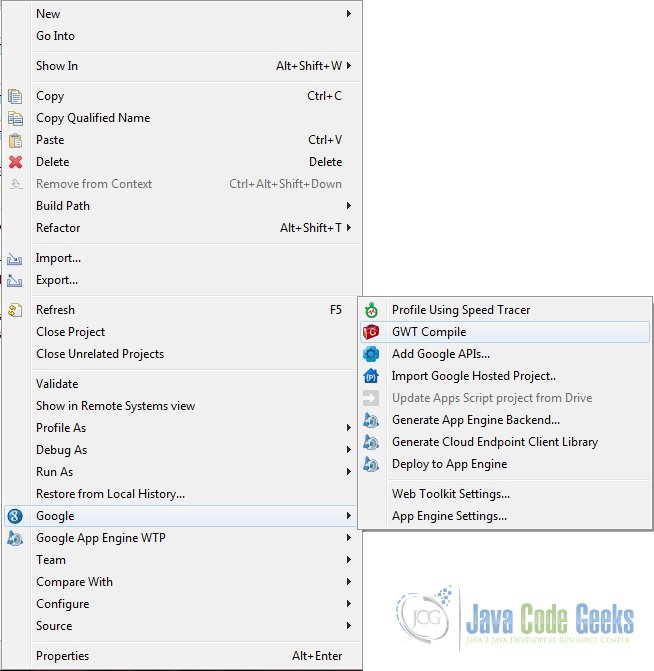
To compile the project right click on the project, go to Google then click GWT Compile.
You will see a GWT Compile window, click on Compile
In the Console you will see the GWT compie logs as below.
Compiling module com.javacodegeeks.GWTChartExample
Compiling 5 permutations
Compiling permutation 0...
Compiling permutation 1...
Compiling permutation 2...
Compiling permutation 3...
Compiling permutation 4...
Compile of permutations succeeded
Linking into E:\meraj\study\eclipse-workspace\GWTChartExample\war\gwtchartexample
Link succeeded
Compilation succeeded -- 17.418s
6. Run
To run the application right click on the project and choose ‘Run As’ => ‘Web Application (GWT Classic Dev Mode)’. You will see a link on the ‘Development Mode’ window as below.
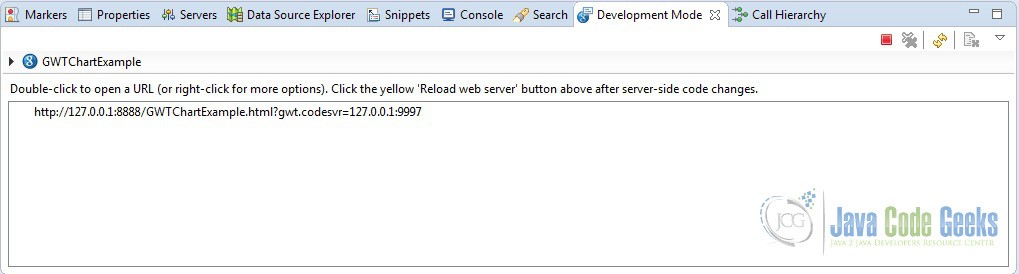
Copy the link and paste it on the browser. Remove the part after ‘?’, including ‘?’. So the URL now becomes – http://127.0.0.1:8888/GWTChartExample.html. Click enter.
7. Download the source file
This was an example of GWT Chart
You can download the full source code of this example here : GWTChartExample
