1. Introduction
This tutorial will introduce us to the new default garbage collector implementation for Java 9, the G1 garbage collector. The G1 garbage collector presents a brand new approach to heap layout and semantic behavior. Optimized for large heaps and tailored to address ever increasing demands of low latency and overall throughput, it provides an excellent opportunity to meet the aggressive non functional requirements of modern day systems.
This tutorial will touch on current and previous types of garbage collectors as well as detail the functioning of the G1 garbage collector. An example program is supplied to attempt to stress the Garbage collector and provide some good log output for analytics using the terms and concepts explained in this tutorial.
2. Technologies used
The example code in this article was built and run using:
- Java 1.8.101 (1.8.x will do fine)
- Maven 3.3.9 (3.3.x will do fine)
- Spring source tool suite 4.6.3 (Any Java IDE would work)
- Ubuntu 16.04 (Windows, Mac or Linux will do fine)
3. Setup
Even though this is a tutorial about the default Java 9 garbage collector one can use the current Java 8 and be explicit about the type of garbage collector algorithm to use. This is what I did for this tutorial as I felt the ubiquity of Java 8 would make this tutorial more accessible to people and would still provide us the opportunity to explore the G1 garbage collector.
4. G1
Before getting to grips with the G1 garbage collector a few key concepts and terms require definition to help us as we continue:
| Term | Definition |
|---|---|
| Region | A section of heap memory sized to a power of 2 no bigger than 64mb which fulfills a role with regard to object allocation |
| CMS | Concurrent Mark Sweep garbage collector algorithm |
| Remembered set | A data structure for keeping references to objects which point from uncollected regions (usually old generation heap regions) into collected regions (usually Eden or Survivor regions) |
| Collection set | The set of regions ear marked for collection at the end of the previous collection. The set of regions is determined by the garbage collector to ensure that it adheres to the maximum pause time specified |
| Card table | A card table is a particular type of Remembered set. An array of bytes is used as the Card table where each byte is a specific card and represents a range of memory addresses in the heap. When the GC dirties a card it indicates that this particular card (memory address range) potentially contains an object(s) which has a pointer(s) from old generation heap to some kind of young generation heap that is possibly due to be collected. The card table or at least each card is updated through a write barrier. By using a memory address range to group object the JVM benefits from some storage space optimizations by not having to store a list of each objects memory address that “fits the bill” |
| Write barrier | A block of code that runs post any write / mutation to an object that results in a reference change when a new reference will point from an old generation region to a young generation region. |
| Humongous object | An object that when allocated results in exceeding the available space of the region (usually young) by more than 50% and will result in an initial mark phase and young collection. It will also result in the object being allocated in an old space region in physically contiguous space. |
| Free list | A list of regions maintained by the JVM that are not yet in use. |
4.1 Background
The G1 garbage collector was first introduced in Java 6 and was only supported from Java 7 update 40. It was created to replace the CMS (Concurrent Mark Sweep) collector. For all Java versions prior to Java 9, it needs to be explicitly enabled via command line arguments. (-XX:+UseG1GC).
The G1 garbage collector got it’s name from the fact that it tries to reap areas of the heap that contain the most garbage, hence garbage first.
4.2 Goal
The goal of the G1 collector is to attempt to adhere, as best as possible, to the pause time guidelines as specified by the command line arguments supplied at runtime or intrinsic defaults. In doing so the overall throughput of the application is improved and the latency is kept within acceptable limits. Important to note that the “nirvana” of performance is an ongoing struggle and even when you have achieved the “perfect” set of configuration, as your application continues to churn in production, so you will need to tweak the GC settings.
4.3 Heap layout
In contrast to the physically contiguous layout of older / other garbage collectors, G1 splits the heap into regions. The regions are created at startup and are sized to a power of 2 up to a maximum size of 64mb per region.
Logical roles are assigned to the regions as they are needed. These roles can be one of:
- Eden: Where new objects are allocated.
- Survivor: Where new objects go if they survive a young collection.
- Old: Where new objects go if they survive long enough to be considered old (tenuring threshold).
All heap regions are not immediately assigned roles, only a few are used and the rest are maintained by the JVM in a list called the “Free list”. Whats important to take away from this is that the heap is no longer a sequence of contiguous sections as in other collectors, but now a series of regions with each region fulfilling a different role.

In this diagram we see the orthodox heap layout for the Serial, Parallel and Concurrent garbage collectors. Important to note is the physically contiguous nature of the different regions.
- Green: represents Eden space where young allocations occur.
- Blue: represents Survivior space where young objects get promoted to when they survive young collections.
- Black: represents Old space where survivor objects get promoted to when they survive more young collections
- Burgundy: represents Permanent space typically used for static permanent objects (eg: classloaders and associated classes).
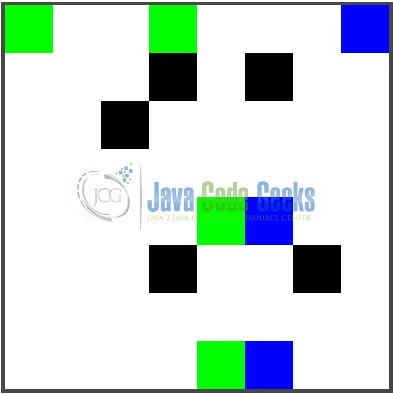
In this diagram we see the heap layout for the G1 garbage collector. Important to note is the non-physically contiguous nature of the regions.
- Green: represents Eden space where young allocations are occur.
- Blue: represents Survivior space where young objects get promoted to when they survive young collections.
- Black: represents Old space where survivor objects get promoted to when they survive more young collections
4.4 Object allocation
As objects get allocated, a region is selected from the “Free list”. The region is assigned a role, usually “Eden” and is used for further allocations until it’s space is depleted, then a new region is selected from the “Free list” and used, this process is continued until a GC pause is encountered. Typically a young generation collection ensues after which the number of regions used for Eden space is adjusted based on metrics collected from previous young collections.
This could mean an increase or decrease in “Eden” regions.
4.5 Young collection
The young collection is a stop the world pause and is parallel in execution.
Garbage objects are reaped and live objects are evacuated from the source region to another target region and compacted at the same time. The target region is typically a survivor region and but can also be an old region (if the tenuring threshold has been reached and we are evacuating a survivor source region).
The new empty Eden regions are returned to the “Free list” and are eligible for new allocations and roles.
Young garbage collections continue until one of the following conditions are met:
- The number of objects in the old generation regions > 45% of heap
- A humungous object allocation is made
then a concurrent mark cycle is started and will run side by side any further concurrent young generations.
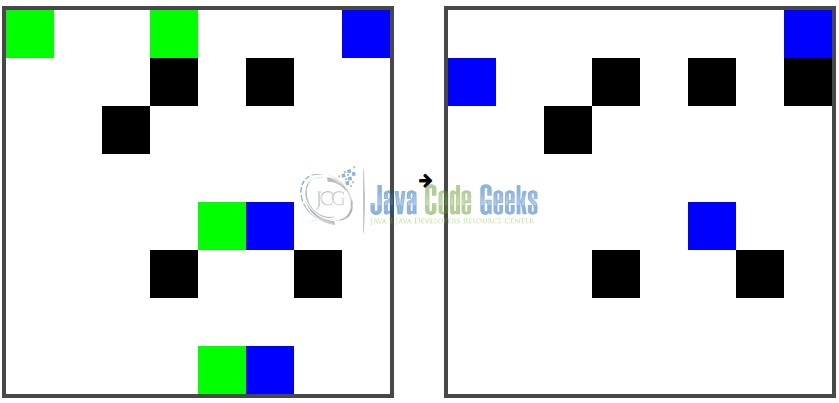
- Green: represents Eden space where young allocations are occur.
- Blue: represents Survivior space where young objects get promoted to when they survive young collections.
- Black: represents Old space where survivor objects get promoted to when they survive more young collections
In this diagram we witness the “before” and “after” state of the heap resulting from a “young collection”. Whats important to note is the lack of green (Eden) regions on the right as they have all been evacuated to survivor regions or been cleared as they are no longer needed. (most objects die young right?). Whats more is that their is one new blue (Survivor) region and one fell away, the new one was where the objects from Eden were copied to and some of the survivor objects died in this collection (no longer reachable) or were promoted to the black (Old) region, which explains the new black region on the right.
4.6 Concurrent marking
Concurrent marking is based on a snapshot of objects for the region taken when this phase begins. This snapshot guarantees that any objects seen as live according to the snapshot are considered live for the duration of the phase. Any new allocations that happen during this phase are considered live regardless of their actual state.
Once this phase completes a young collection will start which will reap Eden regions as well as old regions. This type of collection is called a “mixed collection”.
4.7 Humungous objects
A humongous object is an object that is greater than 50% the size of any Eden space region or by virtue of being allocated will exhaust all Eden space regions. Reservation is facilitated in Old space with physically contiguous regions, if needed to capture the size of the object being allocated.
Unfortunately these objects make very inefficient usage of the regions in question and if the object is very big it can render “dead” or underutilized space leftover in spillover regions. (ie: It uses 1.5 regions leaving the other .5 useless). A concurrent marking cycle will always follow a humongous allocation.
4.8 Full GC
A full GC is a fact of life, even with the G1, albeit, a hopefully infrequent one. A full GC can still occur if the heap utilization is > G1ReservePercentconfiguration value.
5. The program
The below program is designed to hopefully strain the GC to give us some colorful logs that hopefully underscore some of the theory in this article. The program can be compiled with the following command: mvn clean install package and then run, by navigating to the target folder within the project root folder and executing the following:
java -Xms10m -Xmx100m -XX:+UseG1GC -XX:MaxGCPauseMillis=200 -XX:+PrintGC -XX:+PrintGCDetails -XX:+PrintGCTimeStamps -Xloggc:/home/jean-jay/temp/gc.log -jar default_gc-0.0.1-SNAPSHOT.jar
Be sure to replace the -Xloggc:/home/jean-jay/gc.log with an appropriate log file location of your choosing.
GC Stress program
public final class Main {

    private static final long INTERVAL = 60000;
    private static final long PAUSE = 10000;

    private Main() {
        throw new IllegalStateException("Instantiation not allowed");
    }

    public static void main(final String... args) {
        final App app = new App(System.currentTimeMillis());
        app.run();
    }

    private static final class App {

        private final Map<Long, Long> pairs;
        private long lastPause;

        private App(long start) {
            this.pairs = new HashMap<>();
            this.lastPause = start;
        }

        private void run() {
            long value = 0;
            while (!Thread.currentThread().isInterrupted()) {
                try {
                    final Long item = value;
                    this.pairs.put(item, item);
                    value++;

                    pause();
                    clearItems();
                } catch (InterruptedException e) {
                    Thread.currentThread().interrupt();
                }
            }
        }

        private void clearItems() {
            if (isMemoryLow()) {
                this.pairs.clear();
            }
        }

        private boolean isMemoryLow() {
            long totalMemory = Runtime.getRuntime().totalMemory();
            long freeMemory = Runtime.getRuntime().freeMemory();
            long maxMemory = Runtime.getRuntime().maxMemory();

            long usedMemory = totalMemory - freeMemory;
            long availableMemory = maxMemory - usedMemory;

            return (availableMemory / 1024l) < 10000l;
        }

        private void pause() throws InterruptedException {
            long now = System.currentTimeMillis();
            if (now > (this.lastPause + INTERVAL)) {
                Thread.sleep(PAUSE);
                this.lastPause = now + PAUSE;
            }
        }
    }
}
6. The output
GC Stress program log snippet output
Java HotSpot(TM) 64-Bit Server VM (25.101-b13) for linux-amd64 JRE (1.8.0_101-b13), built on Jun 22 2016 02:59:44 by "java_re" with gcc 4.3.0 20080428 (Red Hat 4.3.0-8)
Memory: 4k page, physical 7631852k(2565444k free), swap 7837692k(7837692k free)
CommandLine flags: -XX:InitialHeapSize=10485760 -XX:MaxGCPauseMillis=200 -XX:MaxHeapSize=104857600 -XX:+PrintGC -XX:+PrintGCDetails -XX:+PrintGCTimeStamps -XX:+UseCompressedClassPointers -XX:+UseCompressedOops -XX:+UseG1GC
0.240: [GC pause (G1 Evacuation Pause) (young), 0.0377516 secs]
   [Parallel Time: 36.0 ms, GC Workers: 4]
      [GC Worker Start (ms): Min: 239.7, Avg: 241.7, Max: 243.6, Diff: 3.9]
      [Ext Root Scanning (ms): Min: 0.0, Avg: 0.5, Max: 1.0, Diff: 1.0, Sum: 2.0]
      [Update RS (ms): Min: 0.0, Avg: 3.2, Max: 9.7, Diff: 9.7, Sum: 12.7]
         [Processed Buffers: Min: 0, Avg: 0.8, Max: 2, Diff: 2, Sum: 3]
      [Scan RS (ms): Min: 0.0, Avg: 0.0, Max: 0.0, Diff: 0.0, Sum: 0.0]
      [Code Root Scanning (ms): Min: 0.0, Avg: 0.0, Max: 0.1, Diff: 0.1, Sum: 0.1]
      [Object Copy (ms): Min: 24.5, Avg: 29.6, Max: 31.4, Diff: 6.8, Sum: 118.4]
      [Termination (ms): Min: 0.0, Avg: 0.0, Max: 0.0, Diff: 0.0, Sum: 0.0]
         [Termination Attempts: Min: 1, Avg: 2.0, Max: 4, Diff: 3, Sum: 8]
      [GC Worker Other (ms): Min: 0.0, Avg: 0.0, Max: 0.1, Diff: 0.0, Sum: 0.2]
      [GC Worker Total (ms): Min: 31.4, Avg: 33.3, Max: 35.3, Diff: 3.9, Sum: 133.4]
      [GC Worker End (ms): Min: 275.0, Avg: 275.0, Max: 275.0, Diff: 0.0]
   [Code Root Fixup: 0.0 ms]
   [Code Root Purge: 0.0 ms]
   [Clear CT: 0.7 ms]
   [Other: 1.0 ms]
      [Choose CSet: 0.0 ms]
      [Ref Proc: 0.4 ms]
      [Ref Enq: 0.0 ms]
      [Redirty Cards: 0.4 ms]
      [Humongous Register: 0.0 ms]
      [Humongous Reclaim: 0.0 ms]
      [Free CSet: 0.0 ms]
   [Eden: 6144.0K(6144.0K)->0.0B(2048.0K) Survivors: 0.0B->1024.0K Heap: 6656.0K(10.0M)->6034.5K(13.0M)]
 [Times: user=0.12 sys=0.01, real=0.03 secs]
0.280: [GC pause (G1 Humongous Allocation) (young) (initial-mark), 0.0105684 secs]
   [Parallel Time: 8.8 ms, GC Workers: 4]
      [GC Worker Start (ms): Min: 280.0, Avg: 280.4, Max: 280.9, Diff: 0.9]
      [Ext Root Scanning (ms): Min: 0.0, Avg: 0.8, Max: 1.0, Diff: 1.0, Sum: 3.0]
      [Update RS (ms): Min: 1.5, Avg: 3.0, Max: 6.2, Diff: 4.7, Sum: 12.1]
         [Processed Buffers: Min: 1, Avg: 1.5, Max: 3, Diff: 2, Sum: 6]
      [Scan RS (ms): Min: 0.0, Avg: 0.0, Max: 0.0, Diff: 0.0, Sum: 0.0]
      [Code Root Scanning (ms): Min: 0.0, Avg: 0.0, Max: 0.0, Diff: 0.0, Sum: 0.0]
      [Object Copy (ms): Min: 1.3, Avg: 3.5, Max: 5.5, Diff: 4.1, Sum: 14.1]
      [Termination (ms): Min: 0.0, Avg: 0.9, Max: 2.3, Diff: 2.3, Sum: 3.5]
         [Termination Attempts: Min: 1, Avg: 1.5, Max: 2, Diff: 1, Sum: 6]
      [GC Worker Other (ms): Min: 0.0, Avg: 0.0, Max: 0.0, Diff: 0.0, Sum: 0.1]
      [GC Worker Total (ms): Min: 7.7, Avg: 8.2, Max: 8.6, Diff: 0.9, Sum: 32.8]
      [GC Worker End (ms): Min: 288.6, Avg: 288.6, Max: 288.6, Diff: 0.0]
   [Code Root Fixup: 0.0 ms]
   [Code Root Purge: 0.0 ms]
   [Clear CT: 0.3 ms]
   [Other: 1.5 ms]
      [Choose CSet: 0.0 ms]
      [Ref Proc: 0.7 ms]
      [Ref Enq: 0.0 ms]
      [Redirty Cards: 0.3 ms]
      [Humongous Register: 0.0 ms]
      [Humongous Reclaim: 0.0 ms]
      [Free CSet: 0.0 ms]
   [Eden: 1024.0K(2048.0K)->0.0B(7168.0K) Survivors: 1024.0K->1024.0K Heap: 6282.4K(13.0M)->7887.2K(26.0M)]
 [Times: user=0.02 sys=0.00, real=0.01 secs]
0.291: [GC concurrent-root-region-scan-start]
0.292: [GC concurrent-root-region-scan-end, 0.0009590 secs]
0.292: [GC concurrent-mark-start]
0.334: [GC concurrent-mark-end, 0.0427677 secs]
0.335: [GC remark 0.335: [Finalize Marking, 0.0003684 secs] 0.335: [GC ref-proc, 0.0002129 secs] 0.336: [Unloading, 0.0026497 secs], 0.0037871 secs]
 [Times: user=0.00 sys=0.01, real=0.00 secs]
0.339: [GC cleanup 11M->11M(26M), 0.0010409 secs]
 [Times: user=0.00 sys=0.00, real=0.01 secs]
...
0.845: [GC pause (G1 Evacuation Pause) (mixed), 0.0251433 secs]
   [Parallel Time: 23.5 ms, GC Workers: 4]
      [GC Worker Start (ms): Min: 845.4, Avg: 845.5, Max: 845.6, Diff: 0.2]
      [Ext Root Scanning (ms): Min: 0.5, Avg: 0.6, Max: 0.7, Diff: 0.2, Sum: 2.4]
      [Update RS (ms): Min: 4.0, Avg: 5.5, Max: 7.5, Diff: 3.5, Sum: 21.8]
         [Processed Buffers: Min: 1, Avg: 3.2, Max: 5, Diff: 4, Sum: 13]
      [Scan RS (ms): Min: 0.0, Avg: 0.7, Max: 1.5, Diff: 1.5, Sum: 3.0]
      [Code Root Scanning (ms): Min: 0.0, Avg: 0.0, Max: 0.0, Diff: 0.0, Sum: 0.0]
      [Object Copy (ms): Min: 14.9, Avg: 16.2, Max: 17.3, Diff: 2.4, Sum: 64.7]
      [Termination (ms): Min: 0.0, Avg: 0.0, Max: 0.0, Diff: 0.0, Sum: 0.0]
         [Termination Attempts: Min: 1, Avg: 1.8, Max: 3, Diff: 2, Sum: 7]
      [GC Worker Other (ms): Min: 0.0, Avg: 0.0, Max: 0.0, Diff: 0.0, Sum: 0.1]
      [GC Worker Total (ms): Min: 22.9, Avg: 23.0, Max: 23.1, Diff: 0.2, Sum: 92.1]
      [GC Worker End (ms): Min: 868.5, Avg: 868.5, Max: 868.5, Diff: 0.0]
   [Code Root Fixup: 0.0 ms]
   [Code Root Purge: 0.0 ms]
   [Clear CT: 0.4 ms]
   [Other: 1.2 ms]
      [Choose CSet: 0.0 ms]
      [Ref Proc: 0.5 ms]
      [Ref Enq: 0.0 ms]
      [Redirty Cards: 0.4 ms]
      [Humongous Register: 0.0 ms]
      [Humongous Reclaim: 0.0 ms]
      [Free CSet: 0.0 ms]
   [Eden: 2048.0K(2048.0K)->0.0B(9216.0K) Survivors: 1024.0K->1024.0K Heap: 55.5M(78.0M)->53.5M(83.0M)]
 [Times: user=0.10 sys=0.00, real=0.03 secs]
- lines 1-3: detail the Java vm build, the system resources (memory) and the VM command line arguments when starting the program
- line 4: indicates the type of GC pause, in this case a young collection and the time it took (0.0377516 secs)
- line 5: indicates the start of all parallel tasks that are encompassed in this pause. It also specifies the number of worker threads (4) used and the total time taken by all parallel tasks (36.0 ms)
- line 7: indicates the task that scans the thread stack root variables to trace any paths that might lead into the current region(s) being collected (Collection Set)
- line 8: indicates that the Remembered set is being updated to ensure that the Remembered set can be used for tracking object references across regions, particularly if they point into a region in the Collection set
- line 9: the processing of any buffers that hold dirty card references that must still be placed on the Remembered set
- line 10: the Remembered set of the regions are checked to see if they hold any references to regions in the Collection set
- line 12: the task of copying the objects to new regions
- line 15-17: summary totals for tasks performed
- line 18: fixing the pointers that have changed from moving objects during the copying from region to other regions (promotion)
- line 19: delete any code root entries that were fixed in the step above
- line 20: all dirties cards are removed
- line 29: summarizes the new heap region sizes. We can see that Eden space was full 6144.0K out of 6144.0K and that after evacuation it was reduced to 0 and Eden space region sizes were changed to 2048.0K. Survivor space increased from 0 to 1024.0K and the overall heap went from 6656.0K to 6034.5K and the maximum heap size was increased from 10.0M to 13.0M
- line 31: we see a humongous allocation and an “initial mark” parallel tasks start piggybacking on this young collection as a result of the humongous collection. The reason for the humongous allocation is evident on line 56 where it shows us the following:
Humongous allocation reason
[Eden: 1024.0K(2048.0K)->0.0B(7168.0K) Survivors: 1024.0K->1024.0K Heap: 6282.4K(13.0M)->7887.2K(26.0M)].
line 1: we can see Eden space was fully evacuated, the Survivor space, however, stayed constant and in fact was already 1024.0K in the previous pause, however, the old generation increased by 1.5m and was also resized from 13 to 26m. We know humongous allocations are made on the old heap and here is our proof, probably owing to the single Eden space region being at 50% – 1024.0K of 2048.0K and we know our Eden space regions are powers of 2 in size.
- line 58-61: includes concurrent tasks (run alongside application threads). First step is the initial marking phase which highlights objects directly reachable from
Threador static roots. All the regions of the objects directly reachable are then scanned and marked. - line 62-63: indicates a stop the world pause where a remark occurs based on the snapshot at the beginning of the concurrent mark phase.
7. Summary
In this tutorial we covered some of the core concepts and theory about the G1 garbage collector which is slated to become the default garbage collector for Java 9. We analysed the GC log output of a simple program to better visualize and understand the theory covered in the article.
8. Download the Source Code
This was a Java 9 Default Garbage Collector Tutorial.
You can download the full source code of this example here: Java 9 Default Garbage Collector Tutorial
