Welcome, in this tutorial, we will understand AWS CloudWatch and its related terminology. But remember this is going to be a complete theoretical article with no downloadable content.
1. Introduction to AWS CloudWatch
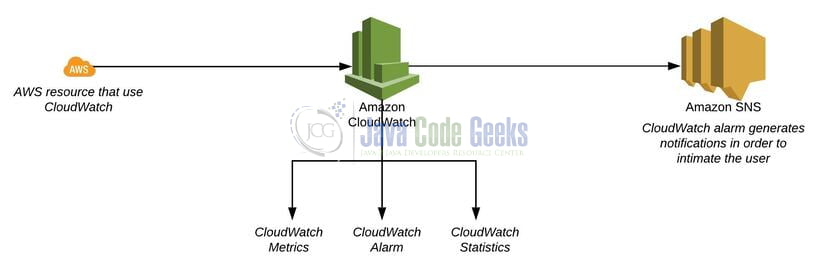
Amazon CloudWatch is a monitoring tool for AWS resources. It displays the metrics and raises alarms on email or mobile push notification if the metric threshold for the AWS resource is breached.
- It is also known as the metrics repository where the AWS resources put the metrics into the repository and help you to retrieve the statistics based on the metrics ingested into AWS CloudWatch
- It does not aggregate data across the different AWS regions and thus the metrics are completely isolated between regions
1.1 CloudWatch Concepts
- Namespaces – It is nothing but a container for the CloudWatch metrics and follows the naming conventions: AWS/service
- Metrics – It represents a time-ordered set of value of metric for a given metric aggregation period (popularly known as the data points) that is published to the CloudWatch. It exists only in the region where the resource is created. The data present in the metric cannot be deleted however it automatically expires at 15 months if no new data is published to it. By default, the enhanced monitoring is not enabled in an AWS free-tier account. However, you can enable it if you would need detailed monitoring or publish your application metrics
- Dimensions – Nothing but a key/value pair that uniquely identifies a metric. AWS allows you to assign up to 10 dimensions to a metric
- Statistics – Metric data aggregations over specific periods. Each statistic in CloudWatch has a unit of measure. Metric data points that specify a unit of measure are aggregated separately
- Percentiles – Indicates the relative standing value of a database i.e. in other words it gives a better understanding of the distribution of the AWS resource metric data
- Alarms – It acts as the notification for the given metric over a specific period and performs one or more specified actions based on the metric value relative to the threshold over time. It is of 3 types i.e. –
- OK – Meaning the metric or expression is within a defined threshold
- ALARM – Meaning the metric or expression is outside of the defined threshold
- INSUFFICIENT_DATA – Meaning the alarm has just started and the metric data is not available to determine the alarm state
While creating an alarm you specify three settings i.e. –
- Period – It is the length of time to evaluate the metric and is expressed in the seconds
- Evaluation Period – It is the number of most recent periods or data points to evaluate when determining the alarm state
- Datapoints to Alarm – Required number of data points within the evaluation period to cause the alarm to go to the ALARM state
- CloudWatch Dashboard – Home page in the CloudWatch console to monitor the AWS resources in a single view, even those AWS resources that are spread across different regions
- CloudWatch Events – Process of delivering the real-time event streams for the changes identified in the AWS environment
- CloudWatch Logs – Offers to monitor logs from the AWS EC2 instances in real-time, AWS CloudTrail logged events, and Log Route53 DNS queries. By default, the CloudWatch logs are kept in forever and never expire
1.2 CloudWatch Pricing
You’re charged –
- For the number of metrics per month
- Per 1000 metrics requested using AWS CloudWatch API calls
- Per dashboard per month
- Per alarm metric
- Per GB of log data collected, analyzed, and archived
- Per million custom events
- Per million cross-account events
2. How Amazon CloudWatch Works
Now as well know a brief about AWS CloudWatch, let us take a look at how AWS CloudWatch works. To understand how the Amazon CloudWatch works we will create an EC2 instance, put some extra load on it, and register that EC2 instance in the CloudWatch console to understand the metric (i.e. the CPU utilization metric). I’m assuming that you’re aware of the AWS basics and have an AWS account for testing purposes (i.e. creating an EC2 instance).
2.1 Using Amazon EC2 Console
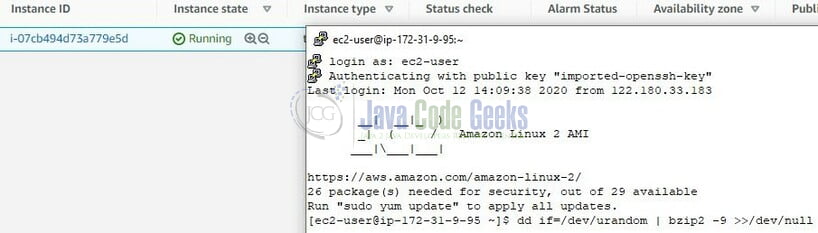
Sign in to the AWS console with your credentials and navigate to the AWS EC2 console. Create a simple Linux based EC2 instance of t2.micro instance type with 8GB of storage through the EC2 console and add some extra load to this EC2 instance through this command – dd if=/dev/urandom | bzip2 -9 >>/dev/null after logging into the EC2 instance through SSH. For this tutorial, we are skipping the step for creating the EC2 instance and will only focus on the CloudWatch.
2.2 Using Amazon CloudWatch Console
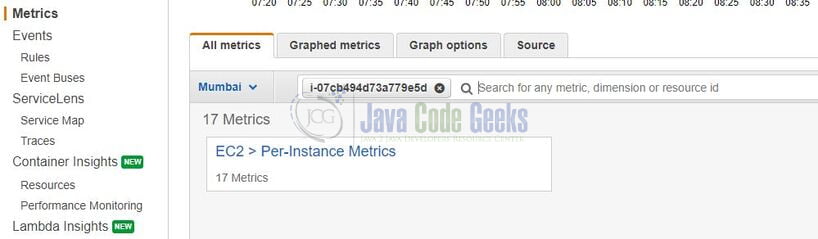
Navigate to the AWS CloudWatch and click on Metrics. Select the region and enter the resource id of the AWS EC2 instance launched in Section 2.1. Before entering the resource id also select the Region in which the resource is launched. Once the resource id is entered and successfully found by AWS corresponding AWS metrics will be shown as shown in Fig. 3.
Click on the metrics and select the appropriate metric for the given instance. For this tutorial, we will select the metric named – CPUUtilization. Select the metric and a graph showing the EC2 instance utilization will be shown as in Fig. 4.
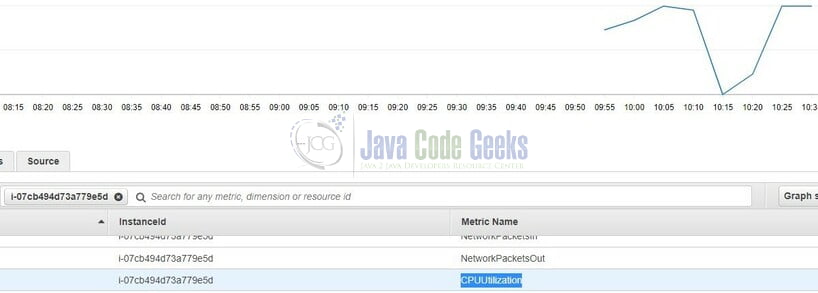
Here in the graph, you have an option to select the duration such as 1h, 3h, 12h, 1d, 3d, 1w, and custom (where you can define the absolute or relative duration conventions). In this graph, you also have an option to draw the graph in different formats like – Line, Stacked, Number, Pie, and Bar. And this how we can generate different metrics to understand the behavior of your resource. For EC2 you have options available like NetworkPacketsIn, NetworkPacketsOut, CPUUtilization, NetworkIn, NetworkOut, etc.
That is all for this tutorial and I hope the article served you whatever you were looking for. Happy Learning and do not forget to share!
3. Summary
In this section, you learned the following:
- Introduction to Amazon CloudWatch and its concepts
- A sample demo of analyzing the resource on the Amazon CloudWatch console

Thanks for providing this valuable and important stuff. Nice work.
thanks.