In this article, we will see the Java Debugger and we will study how to do remote debugging in Eclipse. For this example, I am using Eclipse Luna 4.4.2.
1. Introduction
If you have a web application deployed into a web/application server, you can interact with it remotely from a debugging perspective. The basics are that you must start up the remote JVM with additional parameters and then start up a remote debugging session in Eclipse for the web app in question. The client/server design of the Java debugger allows you to launch a Java program from the computer on your network and debug it from the workstation running the platform. This is particularly useful when you are developing a program for a device that cannot host the development platform. It is also useful when debugging programs on dedicated machines, such as web servers. To use remote debugging, you must be using a Java VM that supports this feature.
To debug a java program remotely, you must be able to launch the program in debug mode on the remote machine, so that it will wait for a connection from your debugger. The specific technique for launching the program and connecting the debugger is VM-specific. The basic steps are as follows:
- Ensure that you are building your Java program with available debug information. (You can control these attributes from the Java => Compiler preference page).
- After you build your Java program, install it, to the target computer. This involves copying the .CLASS files or .JAR files to the appropriate location on the remote computer.
- Invoke the Java program on the remote computer using the appropriate VM arguments to specify debug mode and a communication port for the debugger.
- Start the debugger using a remote launch configuration and specify the address and port of the remote computer.
2. Java Debugger
The Java development toolkit (JDT) includes a debugger that enables you to detect and diagnose errors in your programs running either locally or remotely.
The java debugger allows you to control the execution of your program by setting breakpoints, suspending launched programs, stepping through your code, and examining the contents of variables.
The debugger has a client/server design so you can debug programs running remotely on other systems in the network as well as programs running locally on your workstation. The debug client runs inside the workbench on your workstation. The debugger server runs on the same system as the program you want to debug. This could be a program launched on your workstation (local debugging) or a program started on a computer that is accessible through a network (remote debugging).
2.1 Breakpoints
A breakpoint suspends the execution of a program at the location where the breakpoint is set. Breakpoints can be enabled and disabled via the context menu in the Breakpoints View, or via the context menu in the Java Editor ruler. An enabled breakpoint causes a thread to suspend whenever the breakpoint is encountered. Enabled breakpoints are drawn with a blue circle and have a checkmark overlay once successfully installed. A breakpoint can only be installed when the class the breakpoint is located in has been loaded by the VM. A disabled breakpoint will not cause threads to suspend. Disabled breakpoints are drawn with a white circle. Breakpoints are displayed in the vertical editor ruler and in the Breakpoints view.
3. Configuring Eclipse for remote debugging
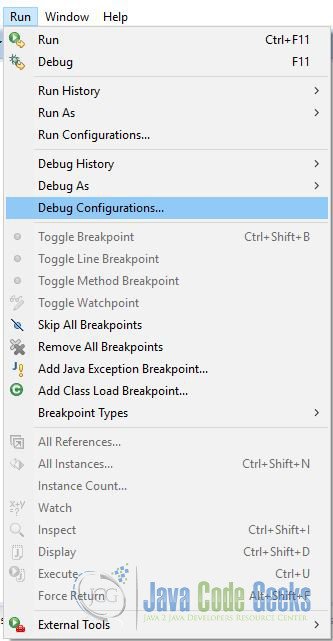
In this section we will see how to configure Eclipse for remote debugging. Select the Run=>Debug Configurations… from the workbench menu bar
Right click on the Remote Java Application option on the left side and choose New or you can click the New toolbar button. A new remote launch configuration is created and three tabs are shown: Connect, Source, and Common. In this window you can provide the configuration details which eclipse can use to connect to the debugging port remotely. The Remote Java Application launch configuration should be used when debugging an application that is running on a remote VM. Since the application is started on the remote system, the launch configuration does not specify the usual information about the JRE, program arguments, or VM arguments. Instead, information about connecting to the application is supplied.
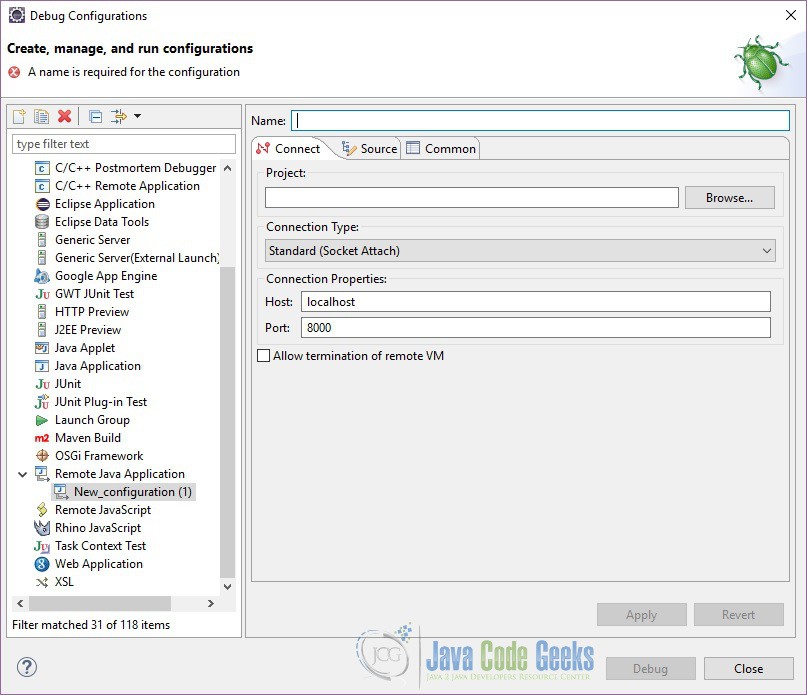
In the Name section give the name of the remote debugging session. You can have multiple debugging sessions with different name pointing to the same server but at one point only one can connect to the given debugging port. In the Project field of the Connect tab, type or browse to select the project to use as a reference for the launch (for source lookup). A project does not need to be specified.
The Connection Type field of the Connect tab allows you to choose how you will connect to the virtual machine. In most cases, you will be attaching to the vm at a specific location, in which case select Standard (Socket Attach). the rest of these instructions assume you have chosen this option. The Standard (Socket Listen) connection type creates a launch that will listen for incoming connections from a remote VM. You will need to specify a port that the launch will listen at.
In the Host field of the Connect tab, type the IP address or domain name of the host where the Java program is running. If the program is running on the same machine as the workbench, type localhost.
In the Port field of the Connect tab, type the port where the remote VM is accepting connections. Generally, this port is specified when the remote VM is launched.
The Allow termination of remote VM flag is a toggle that determines whether the Terminate command is enabled in the debugger. Select this option if you want to be able to terminate the VM to which you are connecting.
Click Debug. The launch attempts to connect to a VM at the specified address and port, and the result is displayed in the Debug view. If the launcher is unable to connect to a VM at the specified address, an error message appears.
3.1 Starting your server in debug mode
For this example we will assume that you are using Jetty as your application server. Assuming you have your webapp deployed into jetty, there are two different ways to approach this:
3.1.1 Via command line
Add the required parameters on the command line like so.
$ java -Xdebug -agentlib:jdwp=transport=dt_socket,address=9999,server=y,suspend=n -jar start.jar
3.1.2 Via start.ini
This approach is best used if you want to debug a particular jetty-distribution and not have to remember the command line incantations.
Edit the start.ini and uncomment the --exec line, this is required if you are adding jvm options to the start.ini file as jetty-start must generate the classpath required and fork a new jvm.
Add the parameters mentioned above in the Command Line option so your start.ini looks like this:
01 02 03 04 05 06 07 08 09 10 11 12 13 14 15 16 17 18 19 20 21 22 23 24 | #===========================================================# Configure JVM arguments.# If JVM args are include in an ini file then --exec is needed# to start a new JVM from start.jar with the extra args.# If you wish to avoid an extra JVM running, place JVM args# on the normal command line and do not use --exec#-------------------------------------------------------------exec-Xdebug-agentlib:jdwp=transport=dt_socket,address=9999,server=y,suspend=n# -Xmx2000m# -Xmn512m# -XX:+UseConcMarkSweepGC# -XX:ParallelCMSThreads=2# -XX:+CMSClassUnloadingEnabled# -XX:+UseCMSCompactAtFullCollection# -XX:CMSInitiatingOccupancyFraction=80# -verbose:gc# -XX:+PrintGCDateStamps# -XX:+PrintGCTimeStamps# -XX:+PrintGCDetails# -XX:+PrintTenuringDistribution# -XX:+PrintCommandLineFlags# -XX:+DisableExplicitGC |
Uncomment any other jvm environmental options you so desire for your debugging session. Regardless of the option chosen, you should see the following lines at the top of your jetty-distribution startup.Listening for transport dt_socket at address: 9999
4. Conclusion
In this article, we saw Java Debugger and how to connect Eclipse to a remote server for debugging. We also saw how to configure the Eclipse debugging session. We have also examined how to start a server in debug mode. For this, we took an example of Jetty.
When setting up the remote launch configuration there are a few items to take note of. You must ensure you enter the correct hostname i.e. the name of the remote computer where you are currently running your code. The hostname can also be the IP address of the remote machine, for example using 127.0.0.1 instead of localhost. The port number must be the number of the port on the remote machine.
Certain Java VMs support another way of starting a remote debug session. In this alternative connection type, the debugger is launched first. The debugger then waits and listens for the VM to connect to it. To debug this way, you must properly configure and launch a remote debug session, then launch the VM, specifying the location of your waiting debugger.
