The purpose of this article is to demonstrate a profiler example in IntelliJ Idea IDE. Specifically, we are going to make use of the JProfiler which can be invoked from within the IDE without any further need for session configuration.
1. Profiling Java applications
Many performance problems in enterprise or web applications result from memory (garbage collector) or database access issues. In case of common memory issues, all tools provide good and similar solutions. To find memory leaks, a good starting point is to compare two memory snapshots to find the difference after garbage collection is done. In general VisualVM, shipped with the Java SDK, is enough to create such a report. The heap viewer comes with the ability to shows references, computing retained sizes and paths to GC roots. Helpful in finding memory leaks is the facility to view the GC-path based on any class.
Apart from memory profiling, with all profiling tools the developer can analyse method calls and the cpu-time needed to perform the operations. So it is possible to find the hotspots in execution, an important basic functionality for profiling your application. Also there are specialized views directly visualizing the hotspots. Why this is so important?
Imagine some very short running sql-statements as an example. This statements won’t appear in the statistics of long-running statements on database side, but anyway can cause a performance issue when getting called in loop. Beside of caching data which results from this statements, to improve performance another possible solution should be to dissolve such iterations to a simpler flat execution path like one database query or another algorithm. The same applies to very frequently called expensive java operations.
2. JProfiler
In JProfiler there is an intuitive way to navigate from the point where we have found memory leaking classes or objects down to exactly the point where the instance is getting created or their references are hold. In combination with the IDE support, this makes it very easy to fix memory-leak problems because you can drill down the problem down to the problem causing sourceline in your favourite IDE and directly fix it at the point where the problem occurred. Also regarding CPU profiling, one very useful information which is shown in JProfiler is the count how often an event occurred in the period of measurement time.
Another useful feature of JProfiler when using JPA in an application, is to track JPQL queries and cumulate them with the provider-generated JDBC statements in the view (as long as showing the JPA and JDBC hotspot statements). This is helpful to identify the called JPQL query and on the other side to see wether loading of an entity results in a join-statement or is done in subselects. It also helps to see unnecessary eager loading or lazy loading annotations.
There are four different profiling modes in JProfiler. Three of them involve a connection with the JProfiler GUI so you can see and analyze data immediately. The three GUI modes result from trade-offs between convenience and efficiency. It is most convenient to simply attach the JProfiler GUI to any running JVM (“Attach mode”), but it is most efficient to load the profiling agent and startup and tell it about the profiling settings immediately (“Profile at startup”). A compromise is to load the profiling agent at startup and tell it later on what the profiling settings should be (“Prepare for profiling”). The fourth mode is used when the use of a JProfiler GUI is not desired or technically possible (“Offline mode”).
2.1 JProfiler as an IntelliJ IDEA plugin
The installation of the IntelliJ IDEA plugin is started by selecting “IntelliJ IDEA [your version]” on the IDE integration tab of JProfiler’s setup wizard miscellaneous options tab of JProfiler’s general settings (use Session->IDE integrations in JProfiler’s main menu as a shortcut) and clicking on [Integrate]
Reminder: Please close IntelliJ IDEA while performing the plugin installation.
If you are performing the installation from JProfiler’s setup wizard, please complete the entire setup first before starting IntelliJ IDEA. A file selector will then prompt you to locate the installation directory of IntelliJ IDEA.
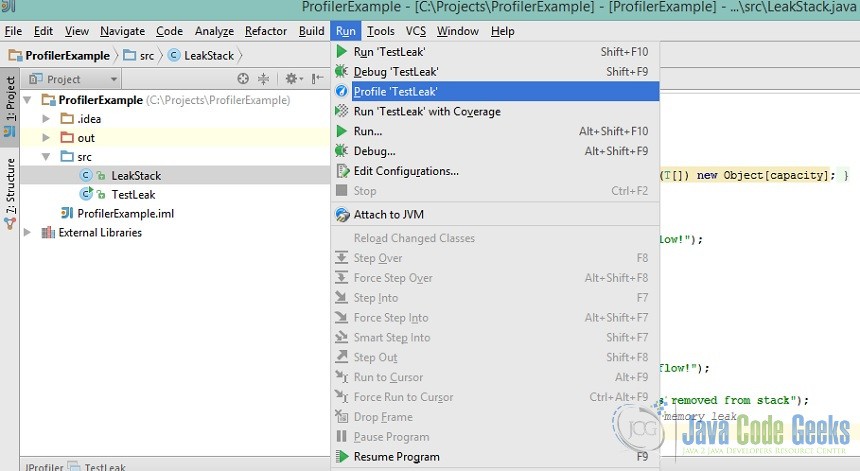
After acknowledging the completion message, you can start IntelliJ IDEA and check whether the installation was successful. You should now see a menu entry Run->Profile in IDEA’s main menu. To profile your application from IntelliJ IDEA, click on the corresponding toolbar button or choose one of the profiling commands in the context menu in the editor or in the Run menu:
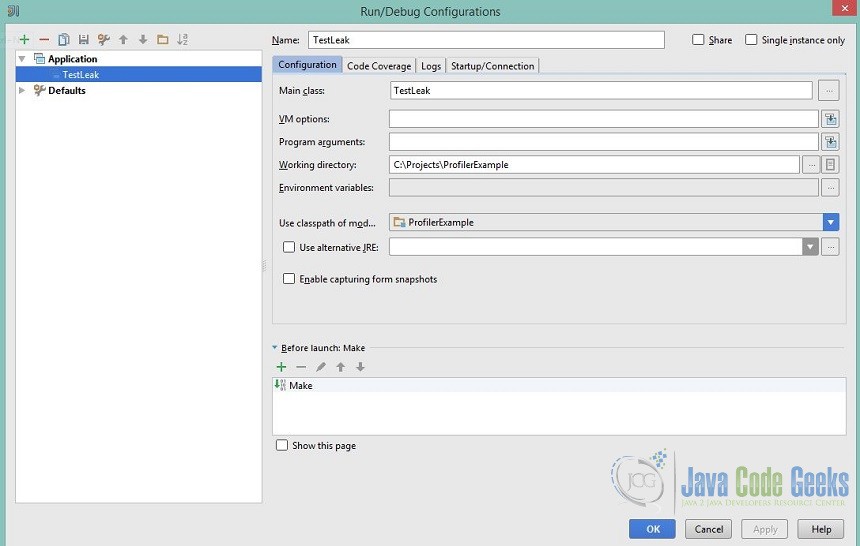
JProfiler can profile all run configuration types from IDEA, also applications servers. To configure further settings, please edit the run configuration, choose the “Startup/Connection” tab, and select the “Profile” entry. Depending on the run configuration type, you can adjust JVM options or retrieve profiling parameters for remote profiling:
3. Source Code for profiling
The below classes have been created in Java Project inside IntelliJ IDEA 14.1.2 and built with JDK 1.7.0_79:
LeakStack class
public class LeakStack {

    private int size;
    private T[] array;

    public LeakStack(int capacity) {
        array = (T[]) new Object[capacity];
    }

    public void push(T item) {
        if (isFull()) {
            throw new RuntimeException("overflow!");
        }
        array[size++] = item;

    }

    public T pop() {
        if (isEmpty())
            throw new RuntimeException("underflow!");
        T item = array[--size];
        System.out.println(array[size] + " was removed from stack");
        //uncomment following line to fix the memory leak
        //array[size] = null;
        return item;
    }

    public boolean isEmpty() {
        return size == 0;
    }

    public int size() {
        return size;
    }


    public boolean isFull() {
        return size == array.length;
    }

}
TestLeak class

public class TestLeak {

    final static int SIZE = 100000;

    public static void main(String[] args) {
        LeakStack s = new LeakStack(SIZE);
        for (int i = 0; i < SIZE; i++) {
            s.push(i);
        }

        System.out.println("Stack is now full with size: " + s.size());

        while (!s.isEmpty()) {
            s.pop();
        }
        System.out.println("Stack is now empty with size: " + s.size());
    }
}
The LeakStack class is basically a stack implementation providing a push() and a pop() method. In the TestLeak class we create a new LeakStack of 100.000 integers by using the push() method and afterwards we empty the stack by using the pop() method.
The pop() method produces the memory leak. The reason is that we only reduce the number of items that are in the stack, but we don’t actually remove them from the stack.The references remain in the array. If we don’t remove them, the garbage collector, won’t destruct the objects, even if the code that produced the object is executed. In order to resolve the memory leak we would have to uncomment line 24:
array[size] = null;
inside LeakStack in order to null out the unused array slot.
3.1 Detecting the memory leak from the IntelliJ profiler
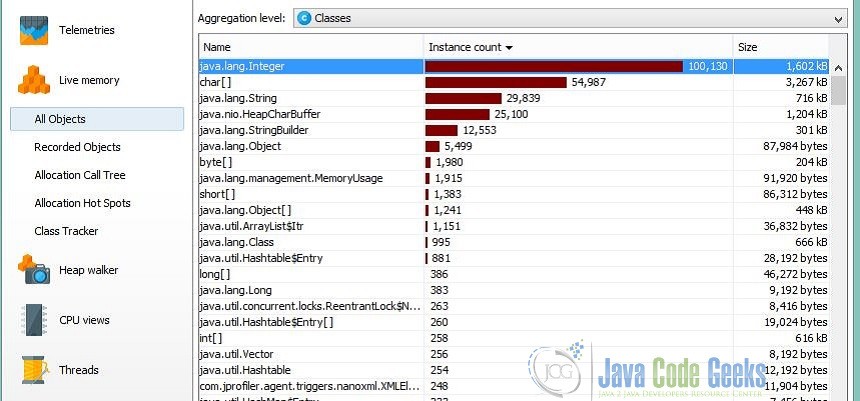
After building the Java Project in IntelliJ IDEA (the one containing the memory leak), we run the profiler from the menu->Run. The JProfiler main window opens and we navigate to the Live Memory session -> All Objects selection on the left of the window. The below image depicts that java.lang.Integer class has 100.130 instances which is the result of the remained references of the popped Integers from the LeakStack which cannot be garbage collected:
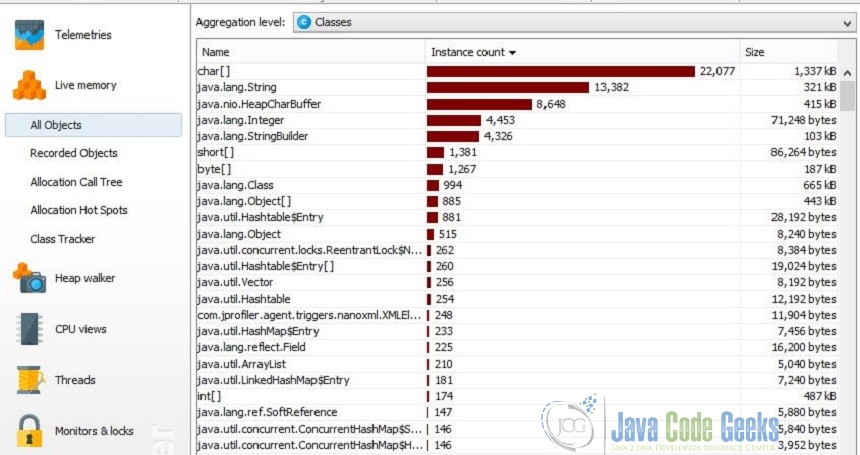
After resolving the memory leak issue as explained previously, we follow the same procedure and the below image depicts that the problem has been resolved:
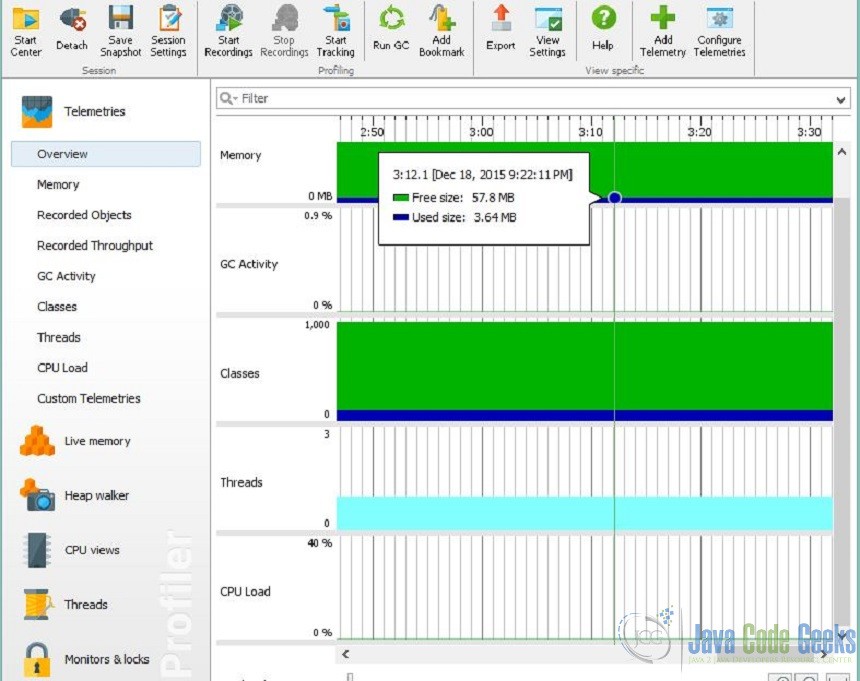
Apart from the live memory details which we presented for this example, the profiler can give us many useful details regarding CPU hotspots and Method Statistics, Thread Monitors and Dumps, Current Locking Graph and Locking History Graph and also Telemetries for classes, recorded objects and GC activity:
4. Download Java Source Code
This was a profiling example in IntelliJ IDEA with the use of JProfiler.
You can download the full source code of this example here: ProfilerExample
