Welcome readers, in this tutorial, we will show how to set up Spring Cloud Zipkin and Sleuth in a Spring Boot application.
1. Introduction
Before starting the tutorial, we will look at the Spring Boot introduction.
- Spring boot is a module that provides rapid application development feature to the spring framework including auto-configuration, standalone-code, and production-ready code
- It creates applications that are packaged as jar and are directly started using embedded servlet container (such as Tomcat, Jetty or Undertow). Thus, no need to deploy the war files
- It simplifies the maven configuration by providing the starter template and helps to resolve the dependency conflicts. It automatically identifies the required dependencies and imports them in the application
- It helps in removing the boilerplate code, extra annotations, and XML configurations
- It provides a powerful batch processing and manages the rest endpoints
- It provides an efficient jpa-starter library to effectively connect the application with the relational databases
- It offers a Microservice architecture and cloud configuration that manages all the application related configuration properties in a centralized manner
To start with this tutorial, we will make use of the Docker tool to have the Zipkin running on the localhost environment. Spring Cloud Sleuth and Zipkin are useful tools when one microservice talks to another microservice hosted in a different location (i.e. each service has its log). This approach requires the extensive use of correlation id which helps to map the request chaining.
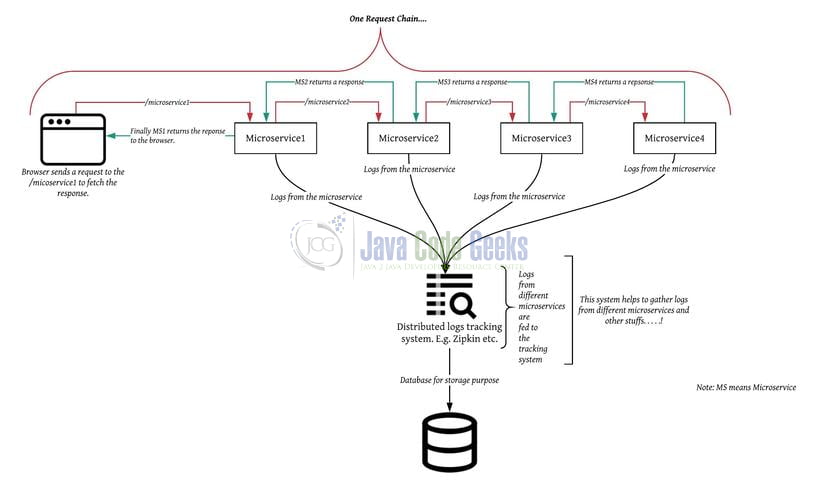
As the diagram visibility is low readers can download the high-resolution architecture diagram from the Download section. Getting back to the discussion, to resolve issues like distributed log tracing, latency problems, etc. Sleuth and Zipkin came into the picture.
- Here the Cloud Sleuth generates the attach the trace id, span id to the logs so that it can be used by tools like Zipkin and ELK for storage and analysis
- Later Zipkin which is a distributed log tracing system gathers this data and helps to troubleshoot the latency problems presents in the Microservices architecture
2. Spring Cloud Zipkin and Sleuth Example
In this tutorial, we will create two different microservices that interact with each other on different ports. Since both the microservices are the same and have a different port number so we will start with one and point out the required different to be made for the second microservice.
2.1 Application pre-requisite
To start with this tutorial, I would recommend readers have a basic understanding of Docker commands and have the Docker up and running on their localhost environment. Readers can watch the video available at this link to understand the Docker installation on Windows OS.
3. Creating a Spring Boot application
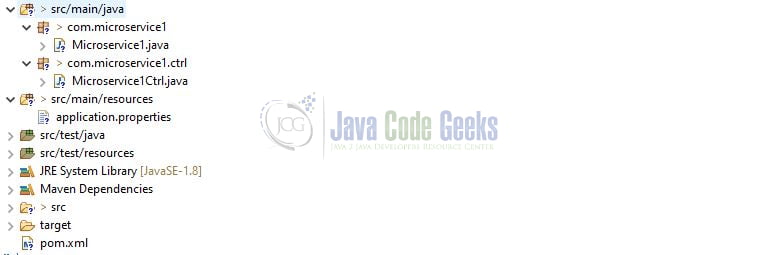
Before going further into this tutorial let us review the application’s project structure.
Let us start building our microservices!
3.1 Maven Dependency
Here we specify the dependencies for the spring boot and spring cloud. Maven will automatically resolve the other dependencies. Make note, both the microservice has the same pom configuration. The pom file will have the following code.
pom.xml
01 02 03 04 05 06 07 08 09 10 11 12 13 14 15 16 17 18 19 20 21 22 23 24 25 26 27 28 29 30 31 32 33 34 35 36 37 38 39 40 41 42 43 44 45 46 47 48 49 50 51 52 53 54 55 56 57 58 59 60 61 | xsi:schemaLocation="http://maven.apache.org/POM/4.0.0 https://maven.apache.org/xsd/maven-4.0.0.xsd"> <modelVersion>4.0.0</modelVersion> <groupId>com.springboot.sleuth</groupId> <artifactId>Springbootslueth-microservice1</artifactId> <version>0.0.1-SNAPSHOT</version> <name>Springboot slueth-zipkin - microservice1</name> <description>Microservice1 to demonstrate to Springboot slueth</description> <parent> <groupId>org.springframework.boot</groupId> <artifactId>spring-boot-starter-parent</artifactId> <version>2.3.0.RELEASE</version> </parent> <!-- To import the spring cloud parent pom as well. --> <dependencyManagement> <dependencies> <dependency> <groupId>org.springframework.cloud</groupId> <artifactId>spring-cloud-dependencies</artifactId> <version>Hoxton.SR4</version> <type>pom</type> <scope>import</scope> </dependency> </dependencies> </dependencyManagement> <properties> <java.version>1.8</java.version> </properties> <dependencies> <dependency> <groupId>org.springframework.boot</groupId> <artifactId>spring-boot-starter-web</artifactId> </dependency> <dependency> <groupId>org.springframework.boot</groupId> <artifactId>spring-boot-starter-log4j2</artifactId> </dependency> <!-- introducing slueth dependency --> <dependency> <groupId>org.springframework.cloud</groupId> <artifactId>spring-cloud-starter-sleuth</artifactId> </dependency> <!-- introducting the spring zipkin dependency --> <dependency> <groupId>org.springframework.cloud</groupId> <artifactId>spring-cloud-starter-zipkin</artifactId> </dependency> </dependencies> <build> <finalName>Microservice1</finalName> </build></project> |
3.2 Java Classes
Let us write the Java classes involved and before starting I am hoping that readers are aware of the basic concepts of creating a Spring boot application. Readers can watch the video available at this link on how to create a simple Spring Boot application.
3.2.1 Controller of Microservice1
Add the following code the controller of microservice1 where we’ll make use of the RestTemplate to call the microservice2 controller to fetch the response.
Microservice1Ctrl.java
01 02 03 04 05 06 07 08 09 10 11 12 13 14 15 16 17 18 19 20 21 22 23 24 25 26 27 28 29 30 31 32 33 34 35 36 | package com.microservice1.ctrl;import org.slf4j.Logger;import org.slf4j.LoggerFactory;import org.springframework.beans.factory.annotation.Autowired;import org.springframework.http.HttpMethod;import org.springframework.web.bind.annotation.GetMapping;import org.springframework.web.bind.annotation.RequestMapping;import org.springframework.web.bind.annotation.RestController;import org.springframework.web.client.RestTemplate;@RestController@RequestMapping(value = "/microservice1")public class Microservice1Ctrl { private final static Logger LOGGER = LoggerFactory.getLogger(Microservice1Ctrl.class); @Autowired RestTemplate restTemplate; // Resource URL - http://localhost:10091/microservice1 @GetMapping public String welcome() { LOGGER.info("Inside microservice1 welcome() method."); // Hitting the microservice2 from microservice1 to fetch the response. // For simplicity, we are directly configuring the URL earlier. // For production ready applications it should be populated from the AWS param store or the properties file. final String response = (String) restTemplate.exchange(microservice2Url, HttpMethod.GET, null, String.class).getBody(); LOGGER.info("The response received from microservice2= " + response); // Returning the response to the user. return response; }} |
3.2.2 Controller of Microservice2
Add the following code the Controller of Microservice2 where we’ll serve the request coming from Microservice1. For simplicity and educational purposes, we have omitted the use of the service and repository layer and directly returning the response from the controller.
Microservice2Ctrl.java
01 02 03 04 05 06 07 08 09 10 11 12 13 14 15 16 17 18 19 20 21 22 23 24 25 26 27 28 | package com.microservice2.ctrl;import org.slf4j.Logger;import org.slf4j.LoggerFactory;import org.springframework.beans.factory.annotation.Autowired;import org.springframework.web.bind.annotation.GetMapping;import org.springframework.web.bind.annotation.RequestMapping;import org.springframework.web.bind.annotation.RestController;import org.springframework.web.client.RestTemplate;@RestController@RequestMapping(value = "/microservice2")public class Microservice2Ctrl { private final static Logger LOGGER = LoggerFactory.getLogger(Microservice2Ctrl.class); @Autowired RestTemplate restTemplate; @GetMapping public String welcome() { LOGGER.info("Inside microservice2 welcome() method and returning response for the requested resource."); // Here for simplicity we are directly returning the response from the controller method. // Reader can have their own set of implementation like calling the service which in turn // interacts with the dB or the calling another microservice. return "Hello world from Javacodegeek"; }} |
3.3 Application Properties
Let us write the properties file involved in this microservices.
3.3.1 Microservice1 – Application Properties
Add the following code to the property file where we’ll specify the application port and application name. Developers are free to choose the properties as per their choice such as application context, logging level, etc.
application.properties
1 2 3 4 5 6 7 | # application port.server.port=10091# application name.spring.application.name=springboot-sleuth-zipkin-microservice1# spring zipkin configuration.# Commenting this property after adding Zipkin jar in the pom.xml so that logs can be directed to the Zipkin dashboard.# spring.zipkin.enabled=false |
3.3.2 Microservice2 – Application Properties
Add the following code to the property file where we’ll specify the application port and application name. Developers are free to choose the properties as per their choice such as application context, logging level, etc.
application.properties
1 2 3 4 5 6 7 | # application port.server.port=10092# application name.spring.application.name=springboot-sleuth-zipkin-microservice2# spring zipkin configuration.# Commenting this property after adding Zipkin jar in the pom.xml so that logs can be directed to the Zipkin dashboard.# spring.zipkin.enabled=false |
4. Run the Application
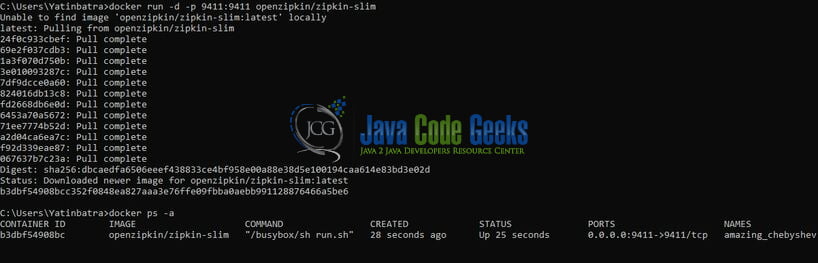
To execute the application, compile the microservices and right-click on the class having the main method, Run As -> Java Application. Make note – Microservice1.java and Microservice2.java are the classes that contain the main method. As a Step2 we will need to run the below Docker command to start Zipkin on our localhost environment.
Docker command
1 | docker run -d -p 9411:9411 openzipkin/zipkin-slim |
If everything goes well the Zipkin image will be pulled from the Docker repository and will be started in the background as shown in Fig. 3.
5. Project Demo
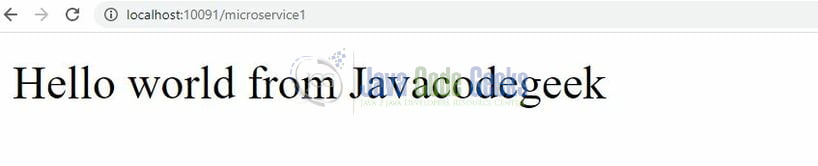
Once the microservices are successfully running developers need to open the browser of their choice and hit the following application URL.
Application URL
Once the hit this tutorial, the request will go to the HTTP GET method of microservice1 controller which in turn will forward this request to the HTTP GET method of microservice2 controller. This request flow implies that the request coming to microservice1 is dependent on microservice2 which in turn is responsible to provide a successful response or an error in case any exception occurs at the microservice2 during the request processing. If everything goes well, the below response will be shown to the user.
And now the most important part comes into play. Here as a developer, I would like to analyze the logs distributed among the different microservice and the timings to troubleshoot the latency problem if any. This is where the Zipkin comes into play. If we recall we started the Zipkin in Section4 through Docker. So developers need to hit the following URL in the browser and they will see the Zipkin dashboard as shown in Fig. 5.
Zipkin Dashboard
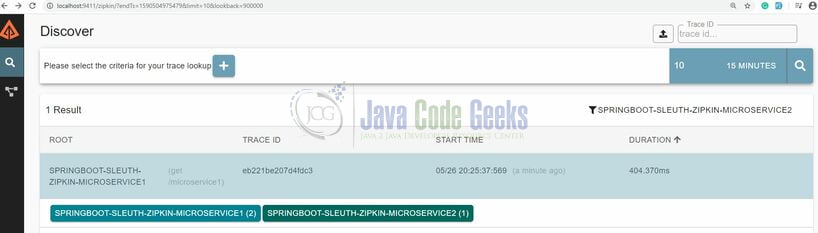
On the dashboard, developers can click on the search logs (i.e. the one shown as the magnifying glass symbol) to see the log trace for the particular request chain. They can further analyze this request chain by selecting it in the dashboard. That is all for this tutorial and I hope the article served you whatever you were looking for. Happy Learning and do not forget to share!
6. Summary
In the above sections, we learned the following:
- Introduction to Spring Boot, Spring Sleuth & Zipkin, and Docker
- Simple application to set up and run the Sleuth & Zipkin application
Developers can download the sample application from the Download section.
7. Download the Project
This was a tutorial of Spring Cloud Zipkin & Sleuth.
You can download the full source code of this example here: Spring Cloud Zipkin and Sleuth Example

Hi , Nice article Yatin.I am trying to integrate sleuth with Spring oauth but am facing issue in it (authorization server shows as seperate span). I have created a sample github project , any help would be appreciated https://github.com/rjain610/Spring-Zipkin-Sleuth-Oauth-Sample
Hello Rahul. Apologies but I am unable to understand the issue here. Can you please connect with me via the support section? Meanwhile I will fork your code from github.