Java Visualizer Tutorial
1. Overview
We look at the Java Visualizer Plugin of IntelliJ IDE in this article. The integrated development environment has an editor, compiler, interpreter, and debugger. They can be used from a user interface for developing applications for the web and mobile. Java visualizer is a plugin for IntelliJ IDE to look at the code execution steps during debugging and check the values of the variables on the path of execution.
2. Java Visualizer
2.1 Prerequisites
Java 8 is required on the Linux, windows, or Mac operating system. IntelliJ Idea Ultimate 2019.1 is necessary on the operating system which you want to execute the code.
2.2 Download
You can download Java 8 from the Oracle website. IntelliJ Idea Ultimate 2019.1 is available at this link.
2.3 Setup
2.3.1 IntelliJ Setup
The IntelliJ idea-2019.1.3.dmg can be downloaded as the macOS Disk Image file. You can mount the disk image file as a disk in the Mac. Ensure that you have copied the IntelliJ IDEA to the Applications folder
2.4 Launching IDE
2.4.1. IntelliJ
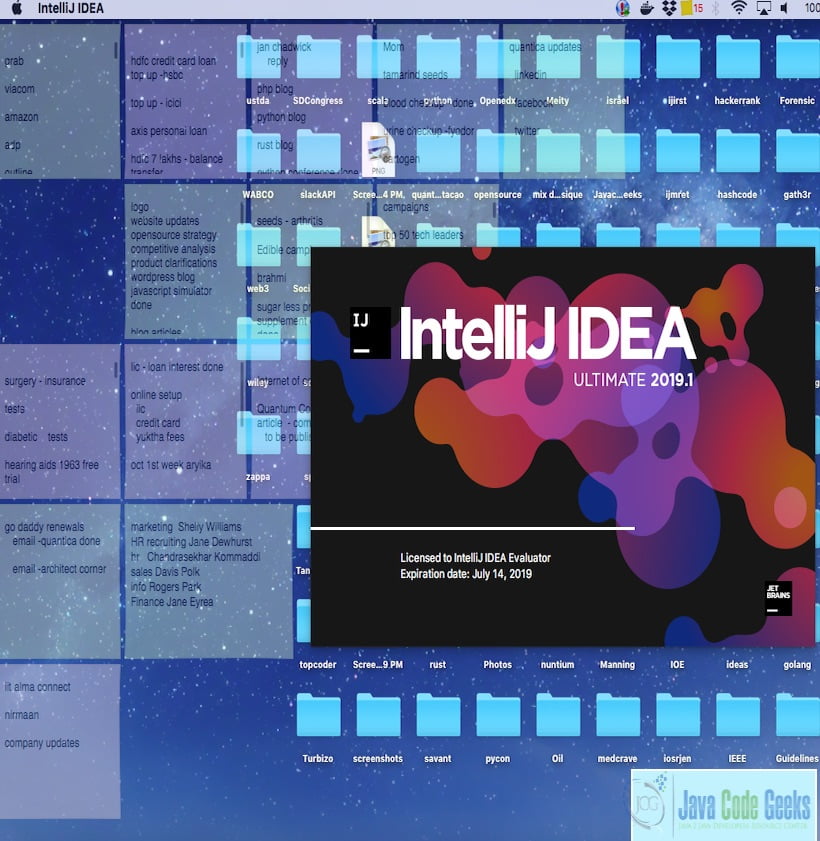
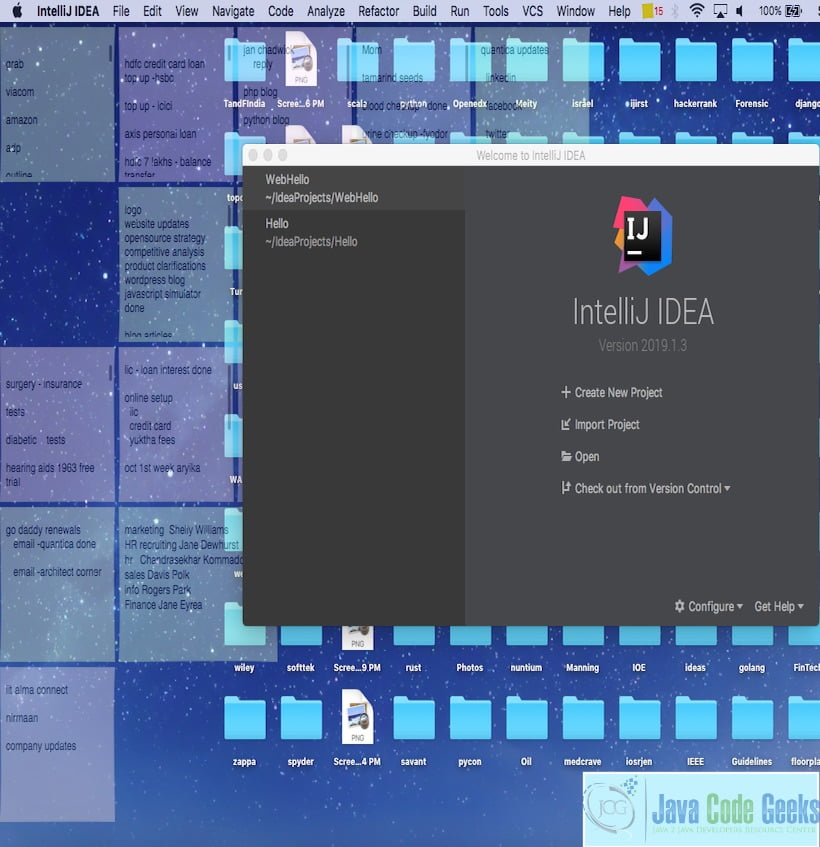
The IntelliJ idea has the functionality to improve efficiency and the programmer’s productivity. The IDE has features related to coding assistance and supplementary tools. Click on the IntelliJ Idea icon to launch the IDE. The welcome screen comes up as shown above.
The screen pops up where you need to create a new project. The screenshot is attached below:
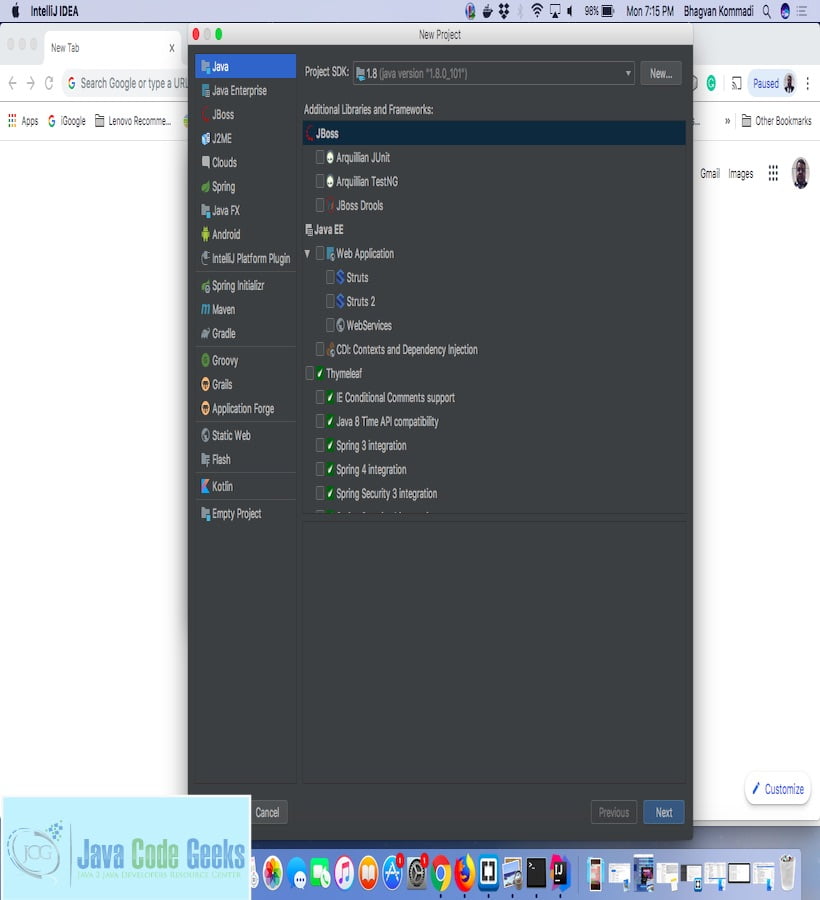
You can create a new project and select the Java Project. It is shown below in the attached screenshot.
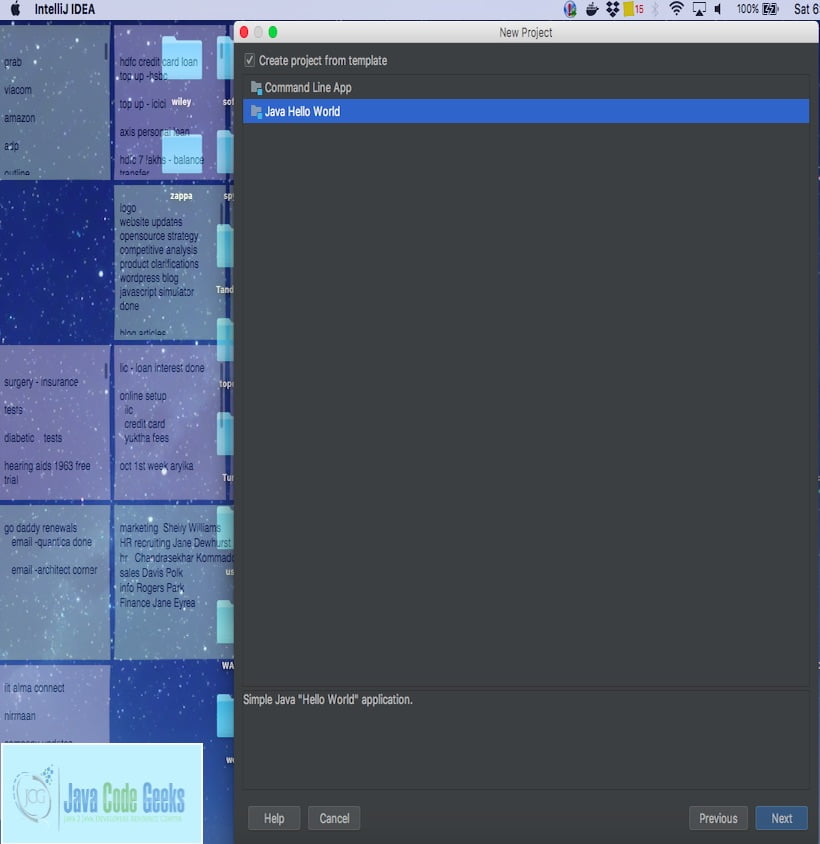
You can create a Java HelloWorld project. The selection can be done as shown in the picture below:
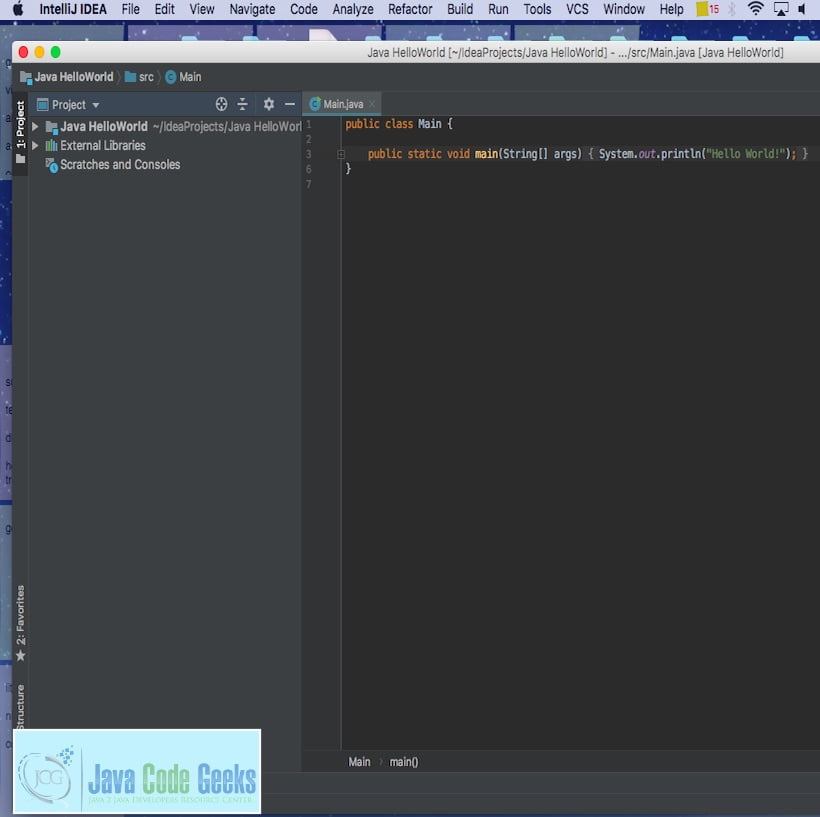
The project workspace screen comes up. The screenshot is as shown below:
2.5 What is a java visualizer?
Java visualizer is a tool to visualize the call stack and objects on the heap. This plugin is used during the debugging of Java applications.
2.6 How do we use a java visualizer?
This plugin is used for visualizing java code execution and its call stack. This helps during debugging and stepping through the code while setting breakpoints. Java visualizer shows the stack of the current debugging program.
2.7 How we can install and execute a visualizer plugin in IntelliJ ?
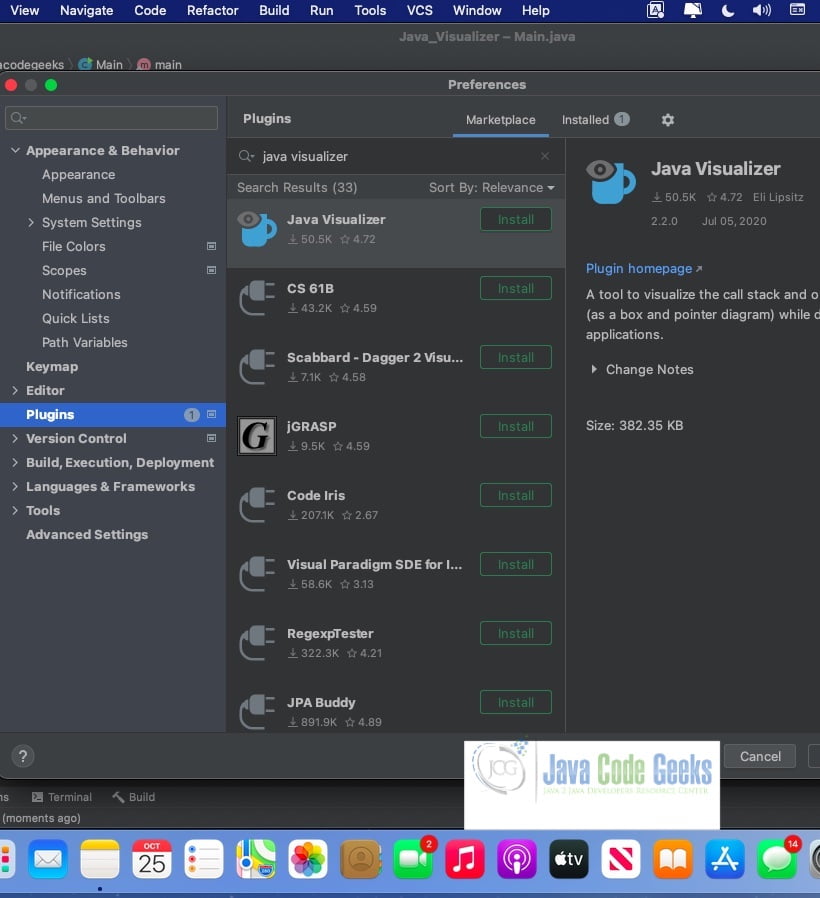
To start with, IntelliJ can be started as an application by clicking on the icon. From the preferences -> plugins, you can search for java visualizer as shown in the screenshot below:
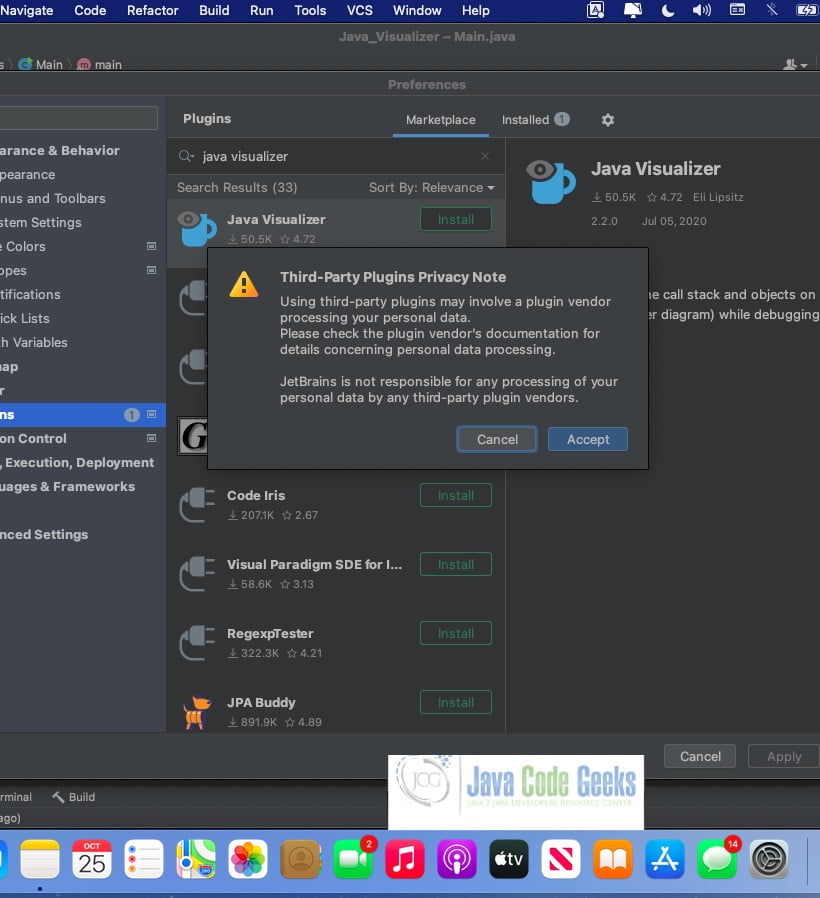
You can click on the green button to install the visualizer plugin.
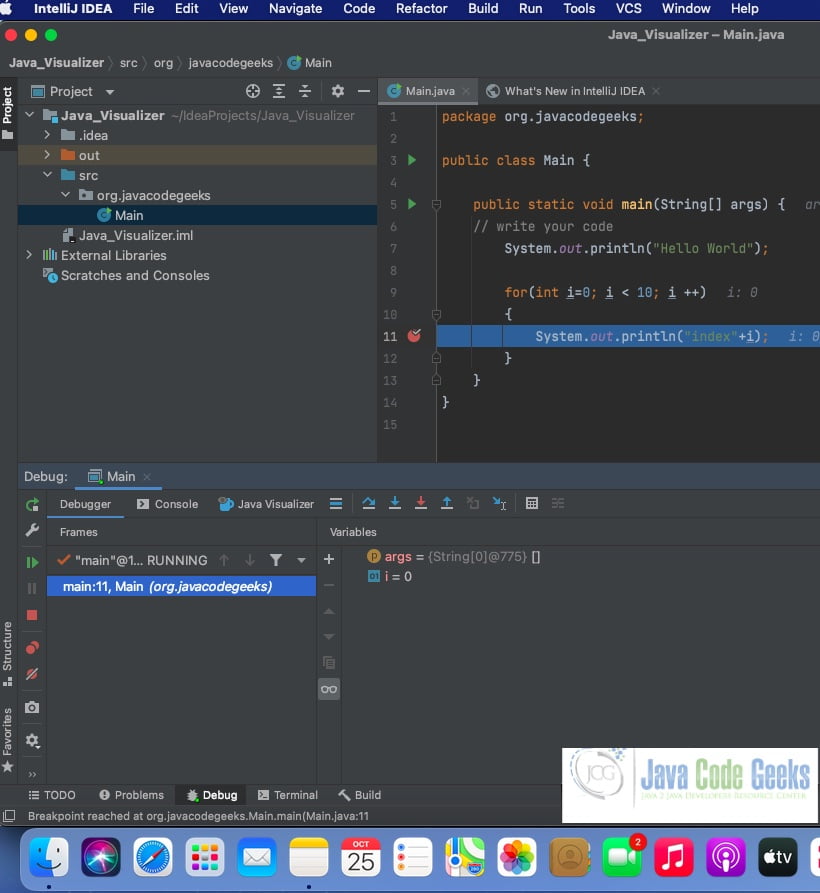
The plugin gets downloaded and installed. You can restart the IntelliJ IDE and look at sample code shown below.
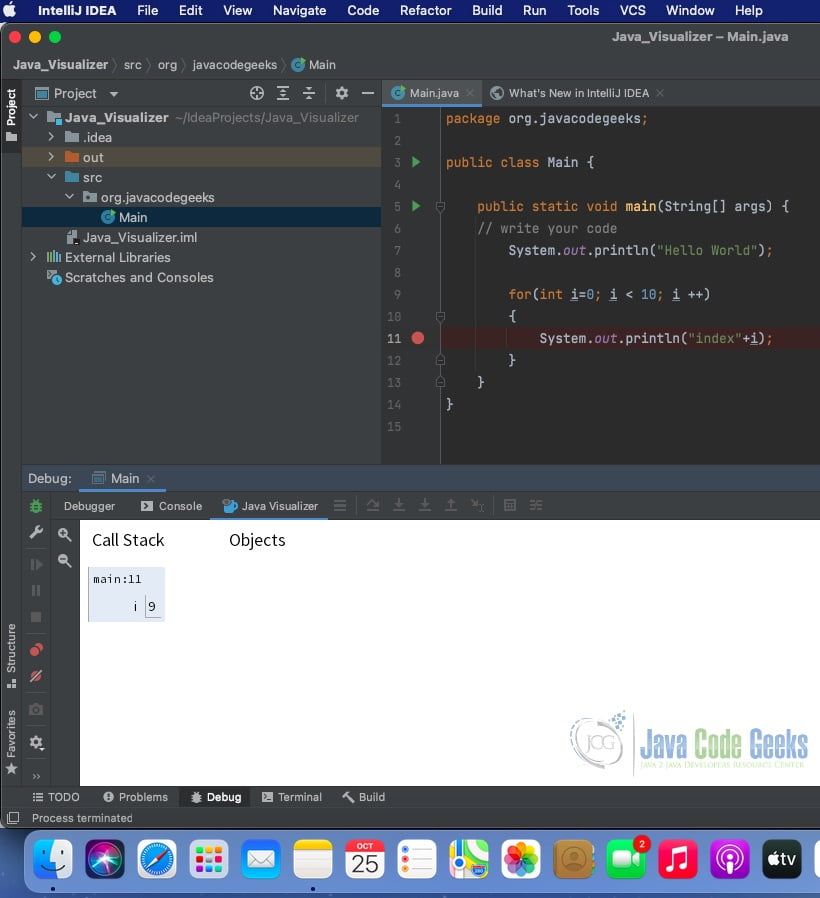
A breakpoint is set on the print statement within the for a loop. Now start debugging the application. Click on the Java visualizer. You can see the call stack as the for loop steps through from 0 to 9.
You can see the value 9 as the for loop reaches the end of the loop.
3. Download the Source Code
You can download the full source code of this example here: Java Visualizer Tutorial

