Java Virtual Machine Tutorial
1. Introduction
Java Virtual Machine (JVM) is a type of process virtual machine which designs to execute Java computer programs in a platform-independent environment. It was first released by Sun Microsystems in 1994 and then split into JVM specification and implementation in 2006. The JVM specification is maintained by Java Community Process (JCP). Click here for a list of JVM implementations. In this example, I will use Oracle HotSpot JVM.
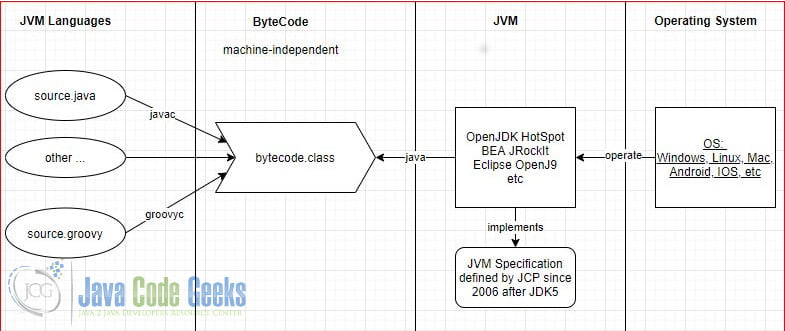
As you seen in Figure 1, JVM languages developers don’t need to worry about the underlying hardware platform when writing the source code. This is a huge advantage as it supports “write once and run anywhere“.
JVM architecture includes several components:
- ClassLoader Subsystem – reads the bytecode from class files and saves into Runtime Data Areas.
- Runtime Data Area – stores the program data into various areas: method area for the class definition; heap for objects and array; stack for local variables, etc.
- Execution Engines – JIT compiler compiles into machine instructions; execution engine executes machine instructions, and Garbage Collectors clean up unreferenced objects in the heap.
- Native Method Interface – communicates with OS via native method’s libraries.
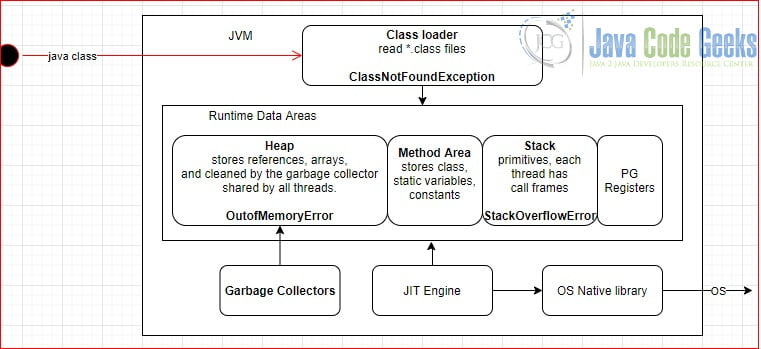
As you seen from Figure 2, these components work like a machine to execute java programs: class loader reads classes and stores data into Runtime area; then JIT compiler converts the bytecode into corresponding machine instructions; then JIT Engine executes the instructions.
In this tutorial, I will demonstrate:
- Execute a Java program and monitor the JVM.
- How to address three common JVM problems:
ClassNotFoundException,OutofMemoryError, andStackOverflowError.
2. Technologies Used
The example code in this article was built and run using:
- Java 11
- Maven 3.3.9
- Eclipse Oxygen
- Logback 1.2.3
3. JVM
When executing a Java program, OS starts a JVM utilizing underline hardware’s RAM and CPU. It recommends to set the JVM minimum heap memory size as 1/16 of the physical hardware’s RAM and maximum memory size as 1/4 of the physical hardware’s RAM. However, It’s best to benchmark the JVM’s memory footprint and then set it accordingly.
3.1 Dependencies
In this step, I will add dependencies in pom.xml.
pom.xml
<project xmlns="http://maven.apache.org/POM/4.0.0"
	xmlns:xsi="http://www.w3.org/2001/XMLSchema-instance"
	xsi:schemaLocation="http://maven.apache.org/POM/4.0.0 http://maven.apache.org/xsd/maven-4.0.0.xsd">
	<modelVersion>4.0.0</modelVersion>
	<groupId>jcg.zheng.demo.jvm</groupId>
	<artifactId>helloworld</artifactId>
	<version>0.0.1-SNAPSHOT</version>
	<build>
		<sourceDirectory>src</sourceDirectory>
		<plugins>
			<plugin>
				<artifactId>maven-compiler-plugin</artifactId>
				<version>3.8.0</version>
				<configuration>
					<release>11</release>
				</configuration>
			</plugin>

		</plugins>
	</build>
	<dependencies>
		<dependency>
			<groupId>ch.qos.logback</groupId>
			<artifactId>logback-access</artifactId>
			<version>1.2.3</version>
		</dependency>

		<dependency>
			<groupId>ch.qos.logback</groupId>
			<artifactId>logback-classic</artifactId>
			<version>1.2.3</version>
		</dependency>
		<dependency>
			<groupId>ch.qos.logback</groupId>
			<artifactId>logback-core</artifactId>
			<version>1.2.3</version>
		</dependency>

	</dependencies>
</project>
3.2 DemoJVM
In this step, I will create a DemoJvm class with the following methods:
infiniteLoop() – simulatesStackOverflowError.outOfMemory() – simulatesOutofMemoryErrorwhen JVM has less than 4 MB heap size.printRuntimeInfo() – prints out the JVM runtime information, including heap size data.sumObject() – creates an object, and calculates a sum from it. The object will be cleaned by GC.main() – starts a Java program. Enter “SO” arguments to simulateStackOverflowError, “OM” forOutofMemoryError, and no argument will sum 1000 objects.
DemoJVM.java
package org.jcg.zheng.demo.jvm;

import java.util.Random;

import org.slf4j.Logger;
import org.slf4j.LoggerFactory;

public class DemoJVM {
	private static final Logger lOG = LoggerFactory.getLogger(DemoJVM.class);

	public static void main(String[] args) {
		lOG.info("DemoJVM starts");
		DemoJVM demo = new DemoJVM();

		if (args.length == 1) {
			if ("SO".equalsIgnoreCase(args[0])) {
				demo.infiniteLoop();
			} else if ("OM".equalsIgnoreCase(args[0])) {
				demo.outOfMemory();
			}
		}

		int total = 0;
		for (int i = 0; i < 1000; i++) {
			total = demo.sumObject(String.valueOf(i), total);
		}

		demo.printRuntimeInfo();

		lOG.info("DemoJVM completes");
	}

	private String name;

	public String getName() {
		return name;
	}

	public int getNumber() {
		Random ran = new Random(10000);
		return ran.nextInt();
	}

	public void infiniteLoop() {
		infiniteLoop();
	}

	public float[][] outOfMemory() {
		//float takes 4 bytes, so this float array takes about 4MB memory
		float[][] ft = new float[1024][1024];
		return ft;
	}

	public void printRuntimeInfo() {
		long MEGABYTE = 1024L * 1024L;
		lOG.info("JVM version =  " + Runtime.version());
		lOG.info("JVM available processors = " + Runtime.getRuntime().availableProcessors());
		lOG.info("JVM free Memory in MB = " + Runtime.getRuntime().freeMemory() / MEGABYTE);
		lOG.info("JVM max Memory in MB = " + Runtime.getRuntime().maxMemory() / MEGABYTE);
		lOG.info("JVM total Memory in MB = " + Runtime.getRuntime().totalMemory() / MEGABYTE);
		lOG.info("*****");
		lOG.info("getSystemClassLoader= " + ClassLoader.getSystemClassLoader().getName());
		lOG.info("getPlatformClassLoader=" + ClassLoader.getPlatformClassLoader().getName());
		lOG.info("Classloader:" + this.getClass().getClassLoader());
	}

	public void setName(String name) {
		this.name = name;
	}

	public int sumObject(String name, int totalBefore) {
		DemoJVM pojo = new DemoJVM();
		pojo.setName(name);
		try {
			Thread.sleep(500);
		} catch (InterruptedException e) {
			e.printStackTrace();
		}
		return totalBefore + pojo.getNumber();
	}

}
4. Monitor JVM with JConsole
In this step, I will execute DemoJVM and monitor it with JConsole.
- Start
DemoJvmwith command line :java -cp lib\*;target\classes\. org.jcg.zheng.demo.jvm.DemoJVM. - Launch JConsole and connect to
DemoJVM. - Capture the monitoring data as Figure 3, 4, and 5.
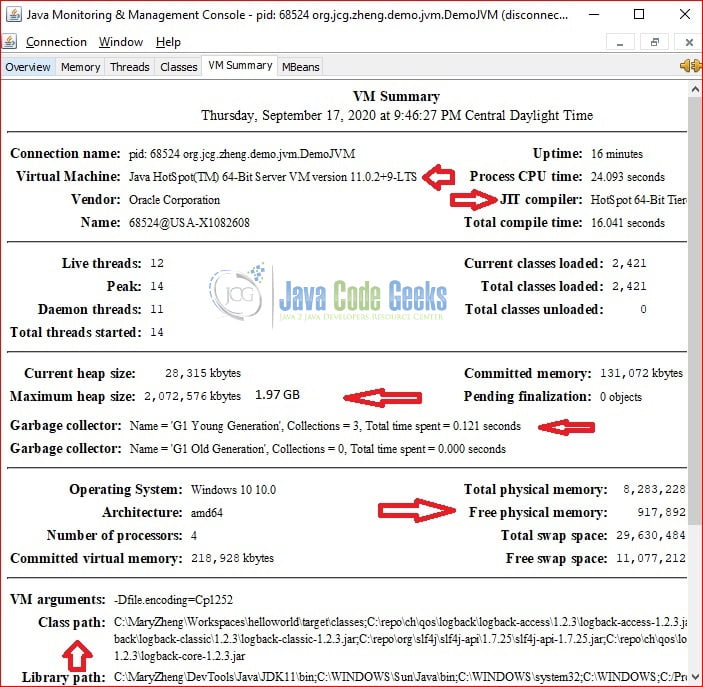
As you seen at Figure 3, it summarizes JVM with classes loaded and threads counts, heap size along with GC, OS and physical memory, Class Path and Library Path.
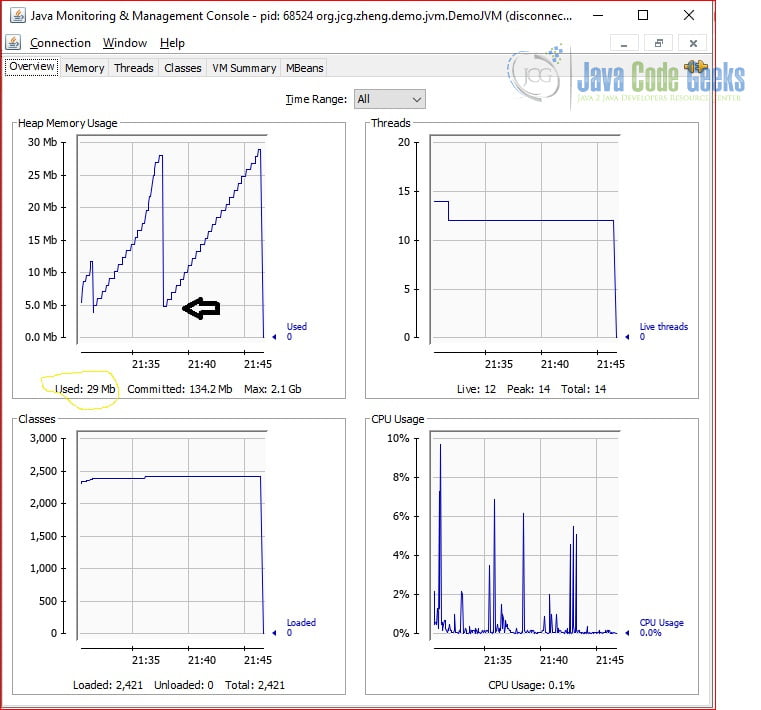
As you saw in Figure 4, its heap memory starts at 5 Mb and peaks at 28 Mb. So DemoJVM’s memory footprint is 23 Mb.
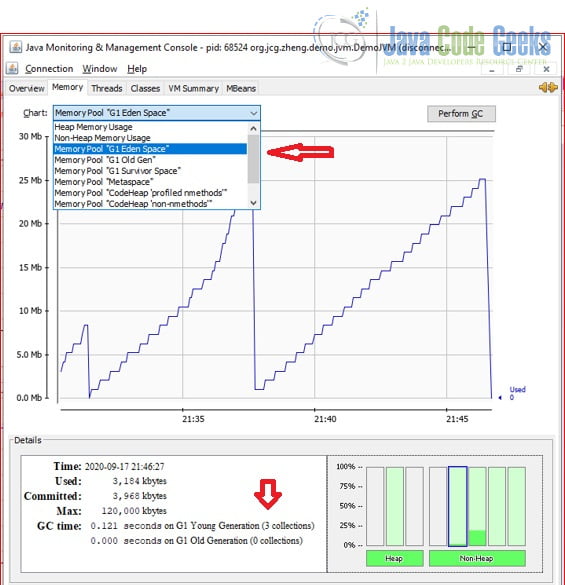
As seen in Figure 5, The “Eden space” is used about 22 MB and minor GC ran 3 times. You can change the “Chart” option for another heap usage.
5. Garbage Collector
One the advantage of Java is that developers no longer need to allocate and de-allocate memory for the objects. The memory allocation is done by the operator and the memory de-allocation is done by the Garbage Collector (GC). General speaking, the heap is divided into three areas and GC is responsible to clean the unreferenced objects in these areas:
- Eden Space – holds the newly created objects. GC is triggered when JVM is unable to allocate space for a new object.
- Survivor Space – holds objects which survived the GC process.
- Old Gen – holds objects which survived many GC processes.
The best performed JVM does not need to run GC at all! If GC does not free enough memory to allocate any space for new objects, then it will throw OutofMemoryError. Here are several JVM options for GC:
- –verbose:gc – to print out the GC information to console
- –Xlog:gc:{gc.log} – to print out the GC information to log file: gc.log
In this step, I will enable the GC log when executing a Java program with 32 MB heap size and capture output here.
DemoJVM output with 32 MB heap size:
C:\MaryZheng\Workspaces\helloworld>java -verbose:gc  -Xms32m -Xmx32m  -cp lib\*;target\classes\. org.jcg.zheng.demo.jvm.DemoJVM
[0.118s][info][gc] Using G1
08:20:10.110 [main] INFO org.jcg.zheng.demo.jvm.DemoJVM - DemoJVM starts
08:28:31.978 [main] INFO org.jcg.zheng.demo.jvm.DemoJVM - JVM version =  11.0.2+9-LTS
08:28:31.980 [main] INFO org.jcg.zheng.demo.jvm.DemoJVM - JVM available processors = 4
08:28:31.982 [main] INFO org.jcg.zheng.demo.jvm.DemoJVM - JVM free Memory in MB = 27
08:28:31.982 [main] INFO org.jcg.zheng.demo.jvm.DemoJVM - JVM max Memory in MB = 32
08:28:31.983 [main] INFO org.jcg.zheng.demo.jvm.DemoJVM - JVM total Memory in MB = 32
08:28:31.983 [main] INFO org.jcg.zheng.demo.jvm.DemoJVM - *****
08:28:31.984 [main] INFO org.jcg.zheng.demo.jvm.DemoJVM - getSystemClassLoader= app
08:28:31.986 [main] INFO org.jcg.zheng.demo.jvm.DemoJVM - getPlatformClassLoader=platform
08:28:31.987 [main] INFO org.jcg.zheng.demo.jvm.DemoJVM - Classloader:jdk.internal.loader.ClassLoaders$AppClassLoader@6e5e91e4
08:28:31.987 [main] INFO org.jcg.zheng.demo.jvm.DemoJVM - DemoJVM completes
C:\MaryZheng\Workspaces\helloworld>
Note:
- line 1: Java command with 32 MB heap size.
- line 2: Garbage first is the default option after JDK7 (-XX:+UseG1GC).
- Set the heap size to 32 MB to meet the memory usage , so GC doesn’t run at all.
Next, I will demonstrate the GC kicks in when the heap size is small by executing the DemoJVM with 4 MB heap size.
DemoJVM output with 4MB heap size.
C:\MaryZheng\Workspaces\helloworld>java -verbose:gc  -Xms4m -Xmx4m  -cp lib\*;target\classes\. org.jcg.zheng.demo.jvm.DemoJVM
[0.103s][info][gc] Using G1
[0.464s][info][gc] GC(0) Pause Young (Normal) (G1 Evacuation Pause) 1M->0M(4M) 2.844ms
[0.592s][info][gc] GC(1) Pause Young (Normal) (G1 Evacuation Pause) 1M->0M(4M) 3.261ms
[0.778s][info][gc] GC(2) Pause Young (Normal) (G1 Evacuation Pause) 1M->1M(4M) 2.577ms
08:32:09.881 [main] INFO org.jcg.zheng.demo.jvm.DemoJVM - DemoJVM starts
[302.855s][info][gc] GC(3) Pause Young (Normal) (G1 Evacuation Pause) 2M->1M(4M) 3.757ms
08:40:30.762 [main] INFO org.jcg.zheng.demo.jvm.DemoJVM - JVM version =  11.0.2+9-LTS
08:40:30.763 [main] INFO org.jcg.zheng.demo.jvm.DemoJVM - JVM available processors = 4
08:40:30.765 [main] INFO org.jcg.zheng.demo.jvm.DemoJVM - JVM free Memory in MB = 2
08:40:30.765 [main] INFO org.jcg.zheng.demo.jvm.DemoJVM - JVM max Memory in MB = 4
08:40:30.765 [main] INFO org.jcg.zheng.demo.jvm.DemoJVM - JVM total Memory in MB = 4
08:40:30.765 [main] INFO org.jcg.zheng.demo.jvm.DemoJVM - *****
08:40:30.766 [main] INFO org.jcg.zheng.demo.jvm.DemoJVM - getSystemClassLoader= app
08:40:30.766 [main] INFO org.jcg.zheng.demo.jvm.DemoJVM - getPlatformClassLoader=platform
08:40:30.767 [main] INFO org.jcg.zheng.demo.jvm.DemoJVM - Classloader:jdk.internal.loader.ClassLoaders$AppClassLoader@6e5e91e4
08:40:30.768 [main] INFO org.jcg.zheng.demo.jvm.DemoJVM - DemoJVM completes

C:\MaryZheng\Workspaces\helloworld>
Note:
- line 1: set heap size to 4MB
- line 3,4,5,7: GC runs 4 times and total pause time is about 10 ms.
6. OutofMemoryError
If the JVM is not able to allocate memory for a new object, an OutOfMemoryError is thrown. Here are a few common options to configure the heap memory:
- –Xms : initial heap memory sizes available to the JVM. The physical hardware must have enough RAM to meet this setting.
- –Xmx : maximum heap memory sizes available to the JVM. It can extend to OS RAM physical limit.
- -XX:+HeapDumpOnOutOfMemory to enable heap dump.
Note: PermGen setting was replaced by MetaSpace after JDK8. Oracle recommends that set the same values for both Xms and Xmx to avoid GC overhead.
In this step, I will start the DemoJVM with “OM” argument and capture output.
Simulate OutofMemoryError
C:\MaryZheng\Workspaces\helloworld>java -verbose:gc  -Xms4m -Xmx4m  -cp lib\*;target\classes\. org.jcg.zheng.demo.jvm.DemoJVM OM
[0.116s][info][gc] Using G1
[0.560s][info][gc] GC(0) Pause Young (Normal) (G1 Evacuation Pause) 1M->0M(4M) 7.501ms
[0.726s][info][gc] GC(1) Pause Young (Normal) (G1 Evacuation Pause) 1M->0M(4M) 3.304ms
[0.940s][info][gc] GC(2) Pause Young (Normal) (G1 Evacuation Pause) 1M->1M(4M) 2.130ms
08:46:18.897 [main] INFO org.jcg.zheng.demo.jvm.DemoJVM - DemoJVM starts
[1.034s][info][gc] GC(3) Pause Young (Normal) (G1 Evacuation Pause) 2M->1M(4M) 3.934ms
[1.041s][info][gc] GC(4) To-space exhausted
[1.042s][info][gc] GC(4) Pause Young (Normal) (G1 Evacuation Pause) 2M->3M(4M) 7.103ms
[1.063s][info][gc] GC(5) Pause Full (G1 Evacuation Pause) 3M->2M(4M) 20.169ms
[1.065s][info][gc] GC(6) To-space exhausted
[1.065s][info][gc] GC(6) Pause Young (Concurrent Start) (G1 Evacuation Pause) 3M->3M(4M) 1.178ms
[1.066s][info][gc] GC(8) Concurrent Cycle
[1.082s][info][gc] GC(7) Pause Full (G1 Evacuation Pause) 3M->3M(4M) 16.280ms
[1.102s][info][gc] GC(9) Pause Full (G1 Evacuation Pause) 3M->3M(4M) 19.132ms
[1.103s][info][gc] GC(8) Concurrent Cycle 37.239ms
[1.104s][info][gc] GC(10) Pause Young (Normal) (G1 Evacuation Pause) 3M->3M(4M) 0.471ms
[1.122s][info][gc] GC(11) Pause Full (G1 Evacuation Pause) 3M->1M(4M) 17.133ms
Exception in thread "main" java.lang.OutOfMemoryError: Java heap space
        at org.jcg.zheng.demo.jvm.DemoJVM.outOfMemory(DemoJVM.java:50)
        at org.jcg.zheng.demo.jvm.DemoJVM.main(DemoJVM.java:19)

C:\MaryZheng\Workspaces\helloworld>Note:
- line 1: starts with “OM” argument.
- line 19:
OutofMemoryErroris thrown.
7. StackOverflowError
When a method is called, a new stack frame is created on the call stack. It holds the invoking method’s parameters, local variables, and the return address of the method. The creation of stack frames will continue until it reaches the end of the method. During this process, if there is no space for a new stack frame to be created, it will throw a StackOverflowError. You can use JVM option : Xss to set the stack thread size.
In this step, I will start the DemoJVM with “SO” argument and capture output.
Simulate StackOverflowError
C:\MaryZheng\Workspaces\helloworld>java -verbose:gc  -Xms4m -Xmx4m  -cp lib\*;target\classes\. org.jcg.zheng.demo.jvm.DemoJVM SO
[0.102s][info][gc] Using G1
[0.456s][info][gc] GC(0) Pause Young (Normal) (G1 Evacuation Pause) 1M->0M(4M) 4.803ms
[0.574s][info][gc] GC(1) Pause Young (Normal) (G1 Evacuation Pause) 1M->0M(4M) 3.696ms
[0.746s][info][gc] GC(2) Pause Young (Normal) (G1 Evacuation Pause) 1M->1M(4M) 2.576ms
08:47:32.768 [main] INFO org.jcg.zheng.demo.jvm.DemoJVM - DemoJVM starts
Exception in thread "main" java.lang.StackOverflowError
[0.861s][info][gc] GC(3) Pause Young (Normal) (G1 Evacuation Pause) 2M->1M(4M) 3.687ms
at org.jcg.zheng.demo.jvm.DemoJVM.infiniteLoop(DemoJVM.java:45)Note:
- line 1, starts with “SO” argument.
- line 7:
StackOverflowErroris thrown.
8. ClassNotFoundException
JVM classloader loads the classes from the classpath. There are two options:
- -Xlog:class+load={LOG_LEVEL} – configure the log level for class load
- -cp – class search path of directories and zip/jar files
- -classpath – class search path of directories and zip/jar files. A “;” separated list of directories, JAR archives, and ZIP archives to search for class files.
In this step, I will demonstrate that JVM will throw ClassNotFoundException when it can not find the class.
Can not Find Class
C:\MaryZheng\Workspaces\helloworld>java -verbose:gc  -Xms4m -Xmx4m  -cp  org.jcg.zheng.demo.jvm.DemoJVM SO
[0.106s][info][gc] Using G1
Error: Could not find or load main class SO
Caused by: java.lang.ClassNotFoundException: SO

C:\MaryZheng\Workspaces\helloworld>
9. Summary
In this tutorial, I explained what JVM is and how the JVM components work together to execute Java programs. I also demonstrated how to use JConsole to monitor a JVM and how to adjust the JVM heap options to achieve better performance.
10. Download the Source Code
You can download the full source code of this example here: Java Virtual Machine Tutorial


Nice article