In this tutorial, we will take a look at the Java Memory Model.
1. Introduction
Let us look at different memory blocks that are part of the Java Virtual Machine (JVM).
2. Java Memory Model
In Java, Heap memory is used to persist objects. Heap memory consists of the Young generation and Tenured spaces. Young generation space has two different segments which are Eden and survivor spaces. Eden space is used for allocating memory for the creation of objects. Survivor space is used for the allocation of memory during garbage collection phases such as the Young and Minor phases. Survivor space has two segments such as S0 and S1. Tenured Space is used for memory allocation of objects which have to reach the maximum tenured threshold. Tenured space is used during garbage collection phases such as minor and young phases.
Metaspace is used for allocation when memory is out of heap memory. Native memory consists of metaspace. There is no max limit for metaspace. This space was referred to as Perm Gen space in Java early versions. Metaspace is used to persist the class definitions used by the class loaders. If the physical memory is not available, the operating system will go for virtual memory. Memory swaps from virtual to physical and the other way is an expensive operation. Java virtual machine provides options to manage the metaspace limit.
Code cache is related to bytecode conversion to the machine code. JIT compiler helps in optimizing the code conversion. Code blocks are compiled to native code by the Just in Time compiler and persisted in the code cache.
2.1 Prerequisites
Java 8 is required on the Linux, Windows, or Mac operating systems. Eclipse Oxygen can be used for this example.
2.2 Download
You can download Java 8 from the Oracle web site. Eclipse Oxygen can be downloaded from the eclipse web site.
2.3 Setup
2.3.1 Java Setup
Below are the setup commands required for the Java Environment.
Setup
JAVA_HOME="/desktop/jdk1.8.0_73"
export JAVA_HOME
PATH=$JAVA_HOME/bin:$PATH
export PATH
2.4 IDE
2.4.1 Eclipse Oxygen Setup
The ‘eclipse-java-oxygen-2-macosx-cocoa-x86_64.tar’ can be downloaded from the eclipse website. The tar file is opened by double click. The tar file is unzipped by using the archive utility. After unzipping, you will find the eclipse icon in the folder. You can move the eclipse icon from the folder to applications by dragging the icon.
2.4.2 Launching IDE
Eclipse has features related to language support, customization, and extension. You can click on the eclipse icon to launch an eclipse. The eclipse screen pops up as shown in the screenshot below:

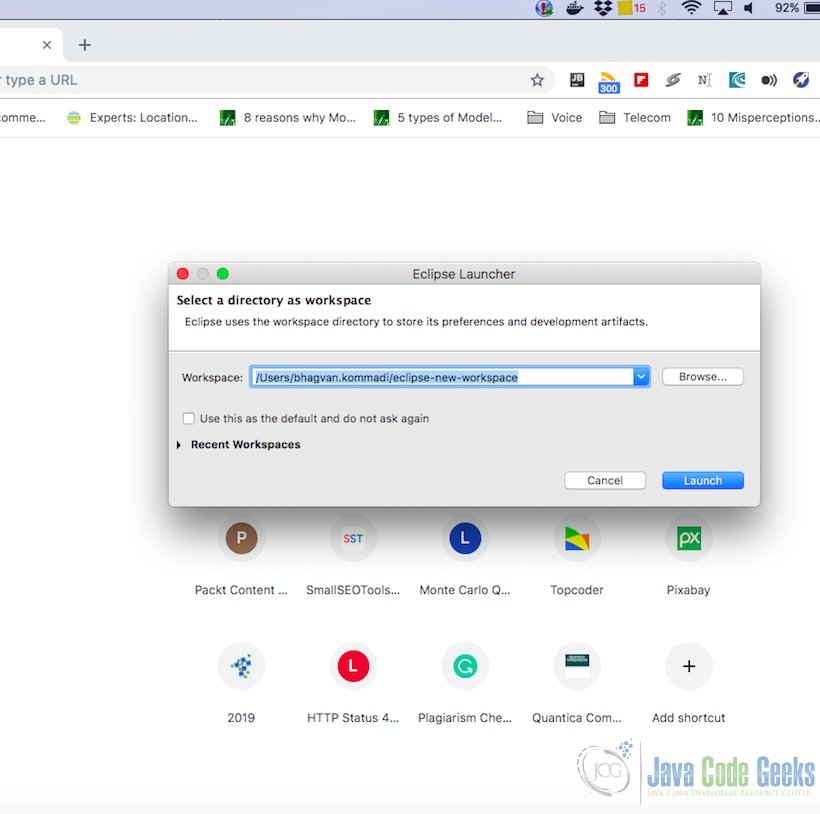
You can select the workspace from the screen which pops up. The attached image shows how it can be selected.
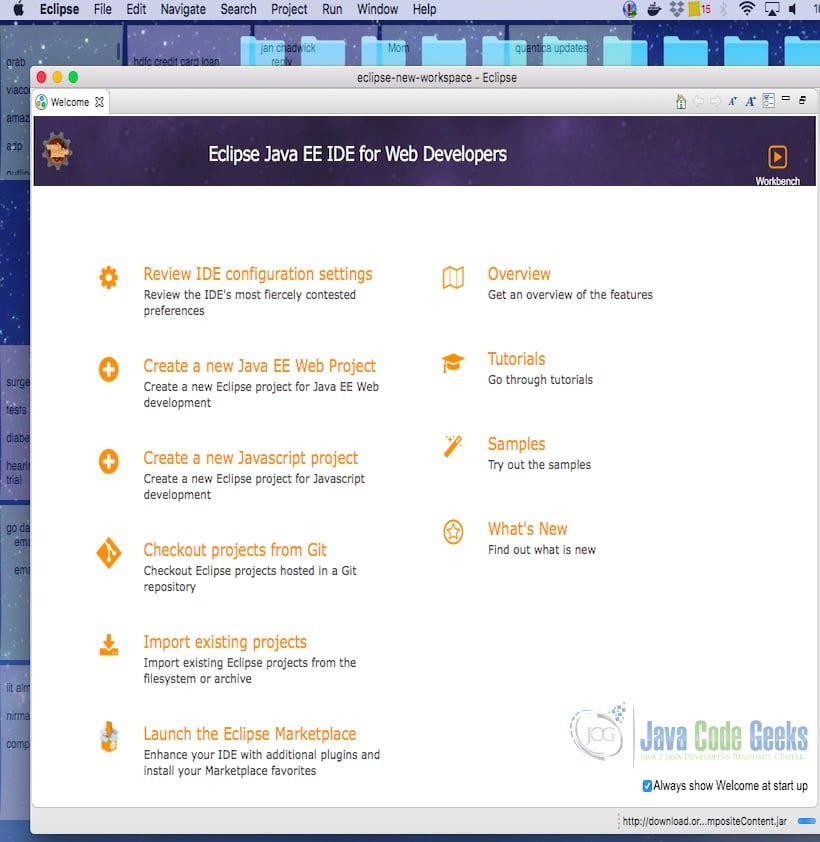
You can see the eclipse workbench on the screen. The attached screenshot shows the Eclipse project screen.
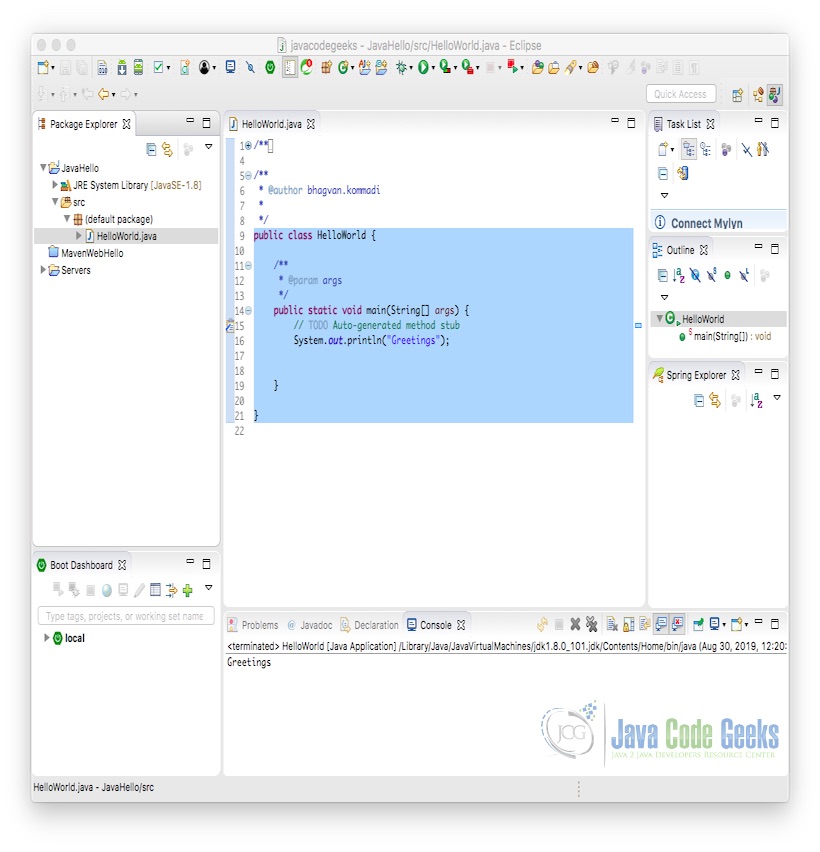
Java Hello World class prints the greetings. The screenshot below is added to show the class and execution on the eclipse.
2.5 Execution Model
Let us now look at the execution model of the JVM memory. Heap memory is used to store application objects during the application lifecycle. Heap is initialized when the JVM starts. The garbage collection process uses the heap storage space for the objects. GC objects are never deallocated. The storage of the objects in JVM is not automatic and it varies based on the system type. Heap memory can be fixed size or contiguous.
In JVM, the Method area is used for saving per-class structures. Runtime constant pool, methods, and fields, code for methods are examples for per-class structures. The method area is initialized during the start of JVM. This memory cannot be cleared during garbage collection. Method are can be of fixed size, contiguous, or expandable size.
Now let us look at the Garbage collection process. Perm Gen space is used to store the application metadata by JVM. This metadata is related to application classes and methods. Java Heap memory is not related to PermGen space. The objects stored in the Perm Gen space are gathered during the garbage collection phase. Perm Gen space consists of Method Area. Runtime constants, method code, and static variables are saved in the method area. JVM manages memory using memory pools. The memory pool consists of immutable objects. String Pool is an example of a memory pool. This pool can be part of Heap or PermGen space. Runtime constant pool consists of the runtime representation of class constants. Stack memory is used for thread execution. It has short-lived method-specific values and object references. These method-specific object references can refer to the heap objects.
2.6 JVM – CPU & RAM Connection
Let us look at CPU and RAM are connected to the JVM memory model. JVM threads use the private stack. The stack consists of frames. The frame is used to save data, method return values, dispatch exceptions, and partial output results. The frame has local variables and partial output results. Push and Pop frames are modified during the stack updates. The stack can be of fixed or dynamic size. Native method stacks are used to save native methods. Native method stack can be of fixed or dynamic size. JVM cannot handle native methods loading.
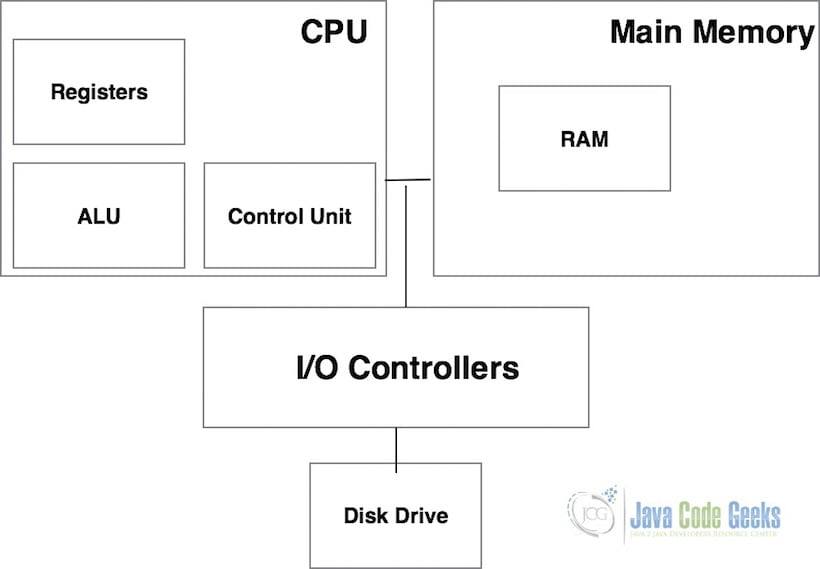
Program counter registers are used by the JVM threads. During the Java code execution, the program counter register has the JVM instruction address. Native code execution is not handled by the PC register. PC register has a return address or native pointers. CPU address has a virtual address and a physical address. These addresses are the same during the compile and load times. They differ in the execution time. A virtual address is related to the program’s logical addresses. Physical addresses refer to logical addresses.
2.7 Race Conditions
Let us look at the race conditions and how the java memory model is affected. Race conditions are related to data races and concurrent program scenarios. A race condition is related to events relative to timing and erroneous results. A data race is related to conflicting reads and writes to the same variable.
Multi-threaded applications typically have race conditions. Multiple threads can access shared data which needs to be handled carefully during race conditions. Thread synchronization problems are tough to find and fix. When execution shifts from one thread to another, CPU will store the local data, pointers related to the current thread, local data, and next thread. A context switch is a term used to refer to the shift of CPU from one thread to another. Context switching is expensive and threads shifting is done when it is important. Context switching isn’t cheap. You don’t want to switch between threads more than necessary.
2.8 Garbage Collections
Garbage collection is related to a process of finding and deleting the unused objects from the memory space. This helps in creating free space and it is used for allocating memory of newly created objects. In java, this process is automatic and in other languages, it is managed manually. The garbage collector finds the objects which are not referred by any other program and delete the unreferenced ones. Garbage collection consists of three phases which are marking, normal deletion, and deletion with compacting. In the marking phase, the garbage collector finds the objects which are not referenced and mark them. During the Normal deletion phase, marked objects are deleted and free space is allocated for newly created objects. After this phase, survived objects are moved into a group.
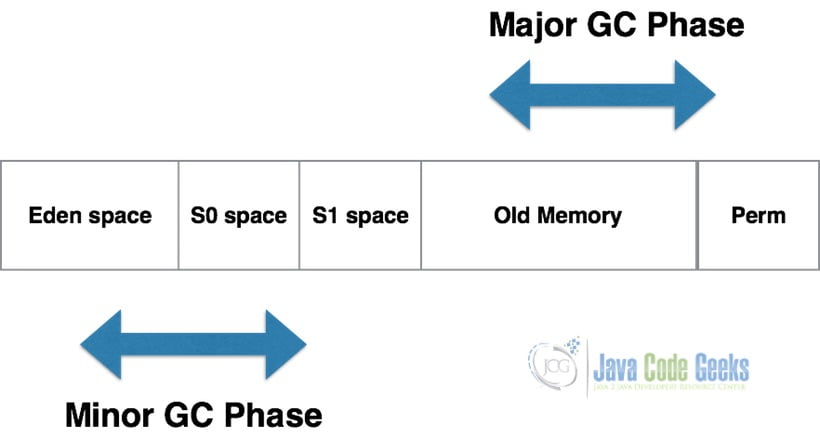
When the garbage collection process starts, the young generation of objects is full. the young generation is the space where the objects are created first. This process is called a minor garbage collection. Young generation space consists of Eden memory and a couple of survivor memory spaces. Eden memory space is used up first and then survivor spaces. Old generation space has long-lived objects which are not cleared during the Minor garbage collection process. The garbage collection process starts when the old generation memory is full. This phase is referred to as Major Garbage collection.ed. It takes a long time for this phase to be completed.
2.9 Memory Options
Let us look at different memory options provided by the JVM. These options can be executed from the eclipse IDE.
| Memory Option | Comments |
|---|---|
| -Xms | You can set the initial heap size when JVM starts |
| -Xmx | You can set the maximum heap size. |
| -Xmn | You can set the size of the Young Generation, rest of the space goes for Old Generation. |
| -XX:PermGen | You can set the initial size of the Permanent Generation memory |
| -XX:MaxPermGen | You can set the maximum size of Perm Gen |
| -XX:SurvivorRatio | You can set the ratio of Eden space and Survivor Space. The default value is 8. |
| -XX:NewRatio | You can set the ratio of old/new generation sizes. The default value is 2. |
2.10 Memory Monitoring Tools
Now let us look at different memory monitoring tools such as jstat, java visual VM, jmap, jcmd, jhat, and hprof. These monitoring tools can be invoked from the eclipse IDE.
jstat
jstat command line tool is used to monitor the JVM memory and garbage collection process. It comes with JDK. The command used for finding the process id of the app is shown below:
Process id check
ps -eaf | grep java
You can run the jstat command with the process id of the application.
jstat command
jstat <processid>
Java VisualVM with Visual GC
jvisualvm tool comes with a java development kit. It is used to visualize the memory and the garbage collection process. The command jvisualvm starts the java visualvm app.
jmap
jmap tool helps in finding the memory statistics for a JVM. jcmd can be used instead of jmap. jmap has heap option to get information about java heap. The command used to execute jmap tool is shown as below:
jmap command
jmap -heap <processid>
The above command provides heap configuration and heap usage summary.
jcmd
jcmd tool helps in creating diagnostic commands to JVM. These commands help in controlling java flight recordings, root cause analysis, and fixing issues. The command used for executing jcmd is shown as below:
jcmd command
jcmd -dump:file=<filename> <processid>
jhat
jhat utility helps in browsing through the object topology in a heap snapshot. This is a substitute for Heap analysis tool (HAT). HAT jhat helps in parsing the heap dump in binary format. It can help find the unintentional object relation. The command used for executing jhat utility is shown as below:
jhat command
jhat <hprof_file>
The above command reads the .hprof file and the server starts on port 7000.
HPROF
HPROF utility is used for profiling heap and CPU. This utility comes with JDK release. A DLL which interfaces with JVM uses a Java virtual machine tool interface. The profiling information is saved as a file or sent to a socket in binary or ASCII format. The tool provides cpu usage, heap statistics, heap dumps, monitor states, thread states, and contention profiles.
HPROF is a tool for heap and CPU profiling shipped with every JDK release. It is a dynamic-link library (DLL) that interfaces with the JVM using the Java Virtual Machine Tool Interface (JVMTI). The tool writes profiling information either to a file or to a socket in ASCII or binary format. The HPROF tool is capable of presenting CPU usage, heap allocation statistics, and monitor contention profiles. In addition, it can report complete heap dumps and states of all the monitors and threads in the Java Virtual Machine (JVM). In terms of diagnosing problems, HPROF is useful when analyzing performance, lock contention, memory leaks, and other issues. HPROF tool can be executed using the command below:
HPROF command
java –agentlib:hprof ClassExample
2.11 Concurrency
In java, concurrency happens in various scenarios such as multi-threads compete to access the same object. The concurrency model is related to the number of threads and the way they communicate with each other. Concurrency models are similar to the distributed system architectures. In a distributed system, different processes talk to each other and try to access the shared information and resources. The concurrent model has similar challenges in handling different resources and handling remote processes. Concurrent models need to handle race conditions and deadlocks.
2.12 Error Handling
In Java, There are memory related errors and exceptions which are mentioned below:
- java.lang.StackOverFlowError — Error due to Full Stack Memory
- java.lang.OutOfMemoryError: Java heap space — Error due to Full Heap Memory
- java.lang.OutOfMemoryError: GC Overhead limit exceeded — Error due to GC Overhead limit
- java.lang.OutOfMemoryError: Permgen space — Error due to Full Permanent Generation space
- java.lang.OutOfMemoryError: Metaspace — Error due to Full Metaspace
- java.lang.OutOfMemoryError: Unable to create new native thread — Error due to creation of new native thread
- java.lang.OutOfMemoryError: request size bytes for reason — Error due to full swap memory space
- java.lang.OutOfMemoryError: Requested array size exceeds VM limit– Error due to array size greater than VM limit
3. Summary
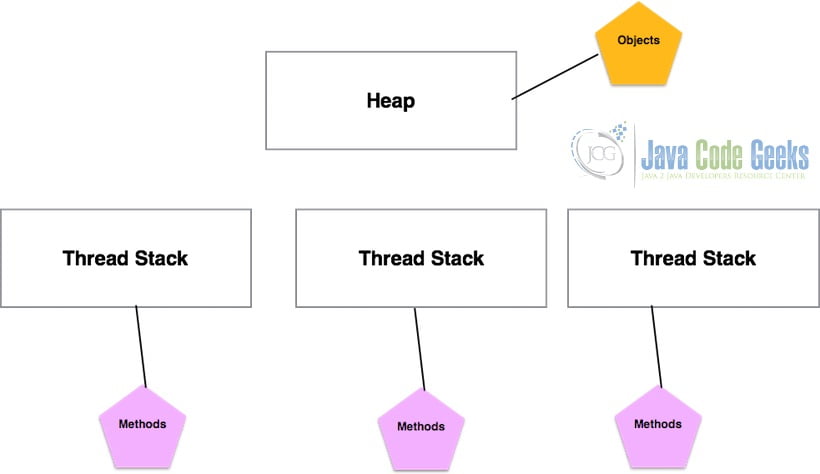
Java Memory model has heap and stack spaces. A stack is used for saving the variables and object references. Heap is used for saving the objects and sharing the objects during the lifecycle of the app. Every application has a single heap and multiple stacks. Each thread has a single stack. When the state of the object is changed, the value is changed in the heap. The reference of the object remains the same.
Java 9 memory model has changes related to program execution and actions. In java 9, Out of Thin Air values can be prohibited. It has new enhancement related to shared memory concurrent algorithms.
4. Download the Source Code
You can download the full source code of this example here: Java Memory Model Tutorial
