In this example, we will demonstrate the concept of throughput as a performance indicator in test execution with JMeter. We will also briefly look into the usage of JMeter’s Throughput Constant Timer. Before understanding the semantics of throughput, let’s look at the concept.
1. Introduction
Apache JMeter is an open source Java based tool that enables you to perform functional, load, performance and regression tests on an application. The application may be running on a Web server or it could be a standalone in nature. It supports testing on both client-server and web model containing static and dynamic resources. It supports wide variety of protocols for conducting tests that includes, HTTP, HTTPS, JDBC, FTP, JMS, LDAP, SOAP etc.
A quick look at some of the features:
- It provides a comprehensive GUI based workbench to play around with tests. It also allows you to work in a non-GUI mode. JMeter can also be ported on the server allowing to perform tests in a distributed environment.
- It provides a concept of template which are pre-defined test plans for various schemes or protocols that can be directly used to create your required test plan.
- It enables you to build test plan structurally using powerful features like Thread Group, Controllers, Samplers, Listeners etc.
- It provides debugging and error monitoring through effective logging.
- It supports parameterized testing through the concept of variables.
- It supports creation of different flavors of test plan that includes Web, Database, FTP, LDAP, Web service, JMS, Monitors etc.
- It allows for remote testing by having different JMeter instances running as servers across nodes and accessed from a single client application.
- It gives you real time test results that covers metrics like latency, throughput, response times, active threads etc.
- It enables you to perform testing based on regular expressions and many more other features.
1.1. What is a Throughput?
Throughput is one component of non functional requirement which falls under performance category and is measured as total no. of transaction or requests in a given time or TPS (transaction per second). It in a way reflects the capacity of the server. The ability of the server in terms of how much load it can take. It is one of the significant indicator that helps in evaluating the performance of application. Maximum throughput is often desirable, though the performance of the system itself cannot be based only on higher throughput. There are certain other indicators like response time, latency etc also needs to be considered when testing the application performance. From the networking perspective, throughput can also mean no. of bytes transfered or sent per second (b/sec or kb/sec). For a typical Web application, throughput is measured as number of requests sent to web server per second.
1.2. Throughput in JMeter
As we know, JMeter is a popular tool to perform the load testing of an application, one of the performance indicator we often verify is the ‘throughput’. We measure throughput by observing the test results. Test results are observed through listener components. The following listener components will allow you to measure or track throughput value:
- Aggregate Graph
- Aggregate Report
- Graph Results
- Summary Report
JMeter also provides a useful timer component to configure or set a constant throughput value to test the application load. Its called JMeter Throughput Constant Timer.
2. JMeter Throughput by Example
We will now demonstrate the usage of throughput in the load testing. We will conduct a sample load test with 100 concurrent users (threads) and evaluate the throughput value. We will perform the load test on the JCG home page (www.javacodegeeks.com). The concurrency will be controlled through the use of Ramp-up Period field of ThreadGroup element.
Before installing JMeter, make sure you have JDK 1.6 or higher installed. Download the latest release of JMeter using the link here. At the time of writing this article, the current release of JMeter is 2.13. To install, simply unzip the archive into your home directory where you want JMeter to be installed. Set the JAVA_HOME environment variable to point to JDK root folder. After unzipping the archive, navigate to <JMeter_Home>/bin folder and run the command jmeter. For Windows, you can run using the command window. This will open JMeter GUI window that will allow you to build the test plan.
2.1. Configuring Users and Ramp-up Time
We will define five ThreadGroup elements each with different ramp-up times. Each thread group will be configured with 100 threads (users). The ramp-up period for each thread group will be 0, 15, 25, 35 and 45 respectively. Ramp-up period indicates the time duration for each thread to start. For example, for 100 threads, if the ramp-up period is 100 seconds then each thread will start after (100/100) 1 second. Each thread group will have a HTTP sampler that will make request to the JCG home page (www.javacodegeeks.com). The below figure shows the ThreadGroup configured with 100 threads and ramp-period as 0.
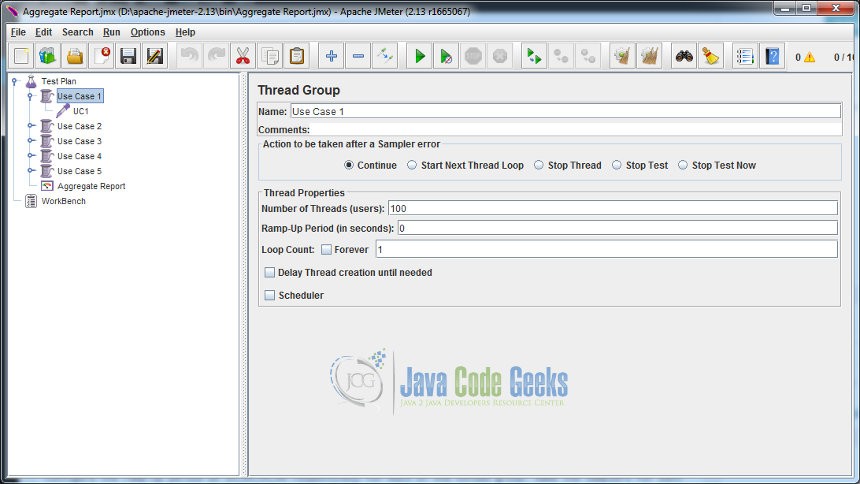
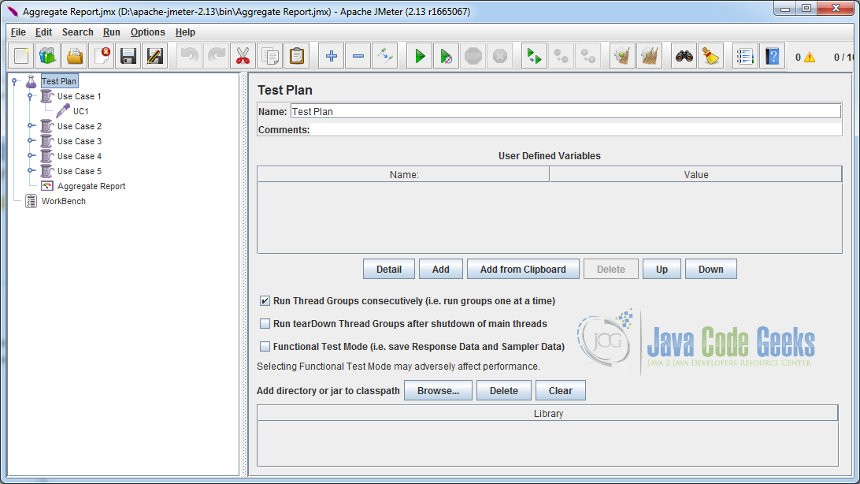
The ThreadGroup name is ‘Use Case 1’. Number of Threads field is set as 100. It signifies 100 users and the Ramp-Up Period is 0. This means that all 100 threads will start at once without any delay. Similarly, you can configure the next four thread groups and name it in the format ‘Use Case [2..5]’. Configure the ramp-up period as 15,25,35,45 respectively for each of the thread group. Name the samplers for each thread group as UC[1..5]. As mentioned, each HTTP sampler will point to JCG home page. Make sure when you run or execute the test, each thread group is executed in sync i.e. one after another. In order to do this, select the Test Plan element and check the Run Thread Groups consecutively field from its control panel (see the image below).
2.2. Observing test results
We will observe the test results using Aggregate Report listener component. Right click on Test Plan element and select Add -> Listener -> Aggregate Report.
Run the test by clicking on the start icon. Let’s observe the througput value for each thread group that is executed.
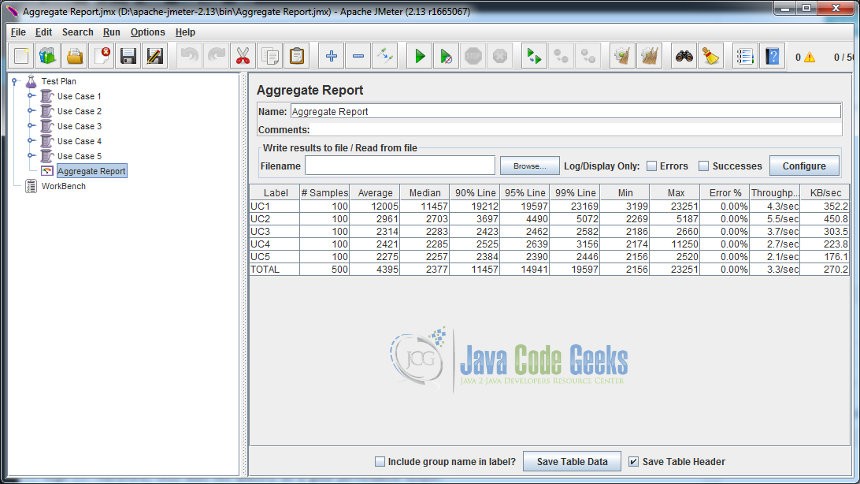
The result of the first thread group which has the ramp-up period as 0. It means all the threads starts at once and therefore puts instant load on the server. This is not a practical scenario and should not be experimented when load testing in production environment. This has a fairly high throughput but the average request load time is very high (12005). Therefore, this does not qualify as a good performance output.
The result of the second and third provides a fairly balanced throughput and request load time. This is because we have configured a decent ramp-up period (not too low or high) for the threads to start. The result of the fourth and fifth thread group shows decline in the throughput as we had configured higher ramp-up period. So our more balanced performance output comes from second and third result. Remember we are only dealing with 100 users (threads), large number of users will require high ramp-up times. Measuring performance of an application can be a very tricky affair.
Some Points to ponder:
If you want to test with heavy load of users (say, in thousands), one can make good use of distributed testing aspect of JMeter. You could have instances of JMeter running on separate instances and perform distributed testing from a single client node.
One can make use of constant timer in JMeter to simulate delays between successive requests. You can provide a value of 300ms which can start a request after 0.3 seconds causing an effective delay which is needed for better throughput.
Ramp-up period of zero is not a good option specially when testing with large no. of users (threads). It can quickly crash your server due to instant and rapid load as all threads start at once. For this example, we are only dealing with 100 users and therefore it is ok to simulate with this kind of 100% concurrency level. Ramp-up period also should not be too high as it makes the throughput indicator void. It means that the server has the capacity but there are not enough threads or user making the request in that short span of time. Ramp-up should be configured in a such a way that the next thread always starts before the prior thread is about to finish. This can give a balanced throughput.
2.3. Constant Throughput Timer
This is a unique timer where you can provide a throughput that is needed for your test. It is a kind of reverse approach to performance testing. Here you perform the load test by specifying the throughput first and try to ensure it fulfills your test criteria. This timer will allow you to specify a constant throughput value but it is not guaranteed that it will maintain that constant throughput during the test. Often you will see throughput coming close to the specified value when running the tests that lasts for longer duration. Apart from specifying the constant throughput value, it also allows you to select the mode of throughput calculation. These are algorithms that calculate delays in proportion with the total number of threads in all the thread groups or in the current thread group. Please note that this timer is only helpful when you perform a test that lasts long.
Let’s configure the Constant Throughput Timer. We will create a ThreadGroup element with 300 users and with the ramp-up time of 50 seconds and loop the test once. We will want to make sure the test takes load of 6 requests per second or 360 requests per minute of throughput. Add the HTTP sampler pointing to the JCG home page. Right click on HTTP Request sampler and select Add -> Timer -> Constant Throughput Timer.
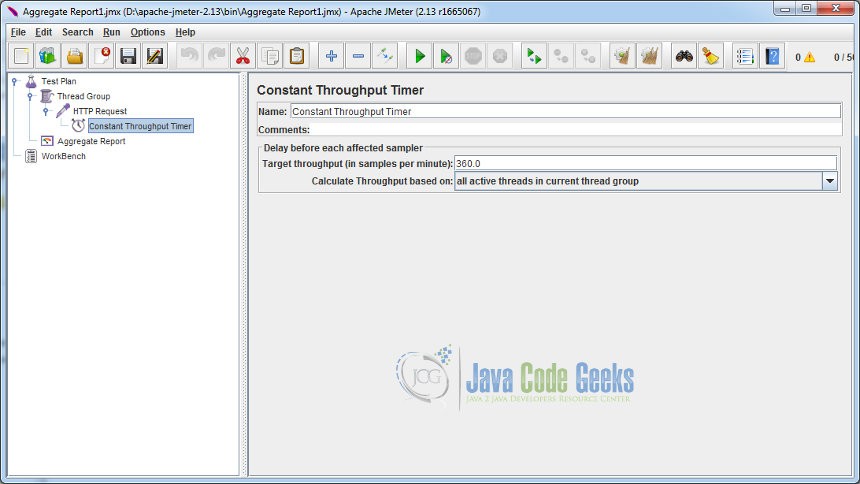
Set the Target throughput field value as 360. This value is no. of samples or requests per minute. It means we want to achieve a throughput of 6 requests per second. We will observe the test results with Aggregate Report listener component. Set the Calculate Throughput based on field value to ‘all active threads in current thread group’. It is one of the algorithm that calculates the delay period based on the number of threads in the current thread group.
Run the test and see the result.
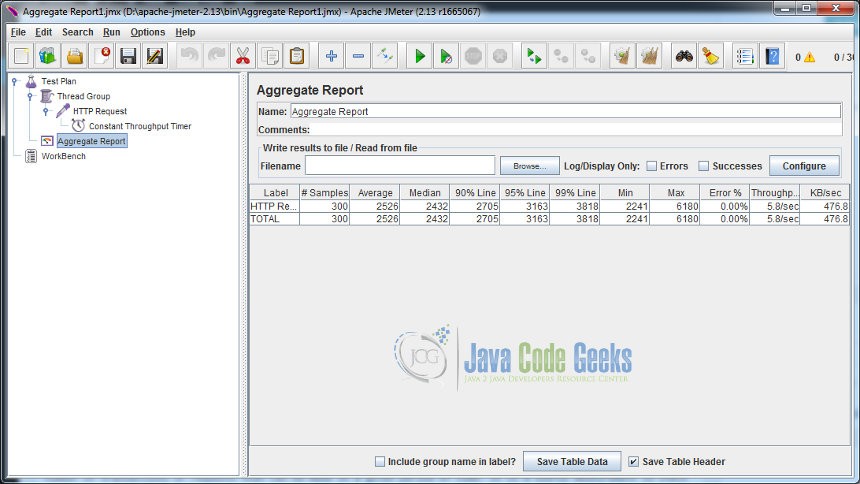
As you can see, our throughput came close to the value of 6.0 requests per second. Note, if you set very high throughput value, there are chances your server may not able to accept the unusual load. So its alwayz recommended to start with lower value and gradually increase the throughput value until it reaches to a more rational acceptable form.
3. Conclusion
Throughput is one of the important performance indicator when evaluating the application performance. It signifies number of transactions or requests that can be made in a given period of time. It is a useful measurement to check the load capacity of the server. Though one should not purely depend on the throughput metrics and it needs to viewed in conjunction with latency and response times. JMeter provides different listener components to track or observe the throughput value. It also provides the timer feature to explicitly set the throughput value. The objective of the article was to demonstrate the usage of throughput as one performance indicator and its application with the Constant Throughput Timer component.
