IntelliJ IDEA Debug Java Application Example
1. Introduction
In this post, we feature a comprehensive Example on IntelliJ IDEA Debug Java Application. When you develop Java applications using any IDE, you will have moments when the application is not giving you the desired results. You revisit the logic again to see the erring portion but everything seems to be perfect. But then, why is the program outputting something else than what it should be doing? Certainly the world is not scheming against you. At this point, debugging plays a vital role in helping you finding the bugging piece of logic.
My favourite IDE is IntelliJ. Debugging Java programs is straight forward in this IDE. For illustration, I’ll debug a small program whose objective is to take a series of numbers and print a specific word when the numbers are divisible by 3, 5 or 15. For example, if a number is divisible by 15, the program should print “Fifteen”, if it is divisible by 5, it should print “Five” and if it is divisible by 3, it should print “Three”. For all other numbers, it should just print the number.
2. Technologies used
The example code in this article was built and run using:
- Java 1.8.0_102
- Maven 3.2.5
- IntelliJ IDEA 14.0.3
3. Code example
Let’s write a simple program as introduced above and see how we can debug it. Below is the code if you want to carry out the steps along with this article.
package com.example.demo;

public class DebugDemo {

    public static void main( String[] args ) {
        // Loop numbers from 1 to 100
        for (int i = 1; i <= 100; i++) {
            if (i % 3 == 0) {
                System.out.println("Three");
            } else if (i % 5 == 0) {
                System.out.println("Five");
            } else if (i % 15 == 0) {
                System.out.println("Fifteen");
            } else {
                System.out.println(i);
            }
        }
    }
}
4. Running and debugging the application
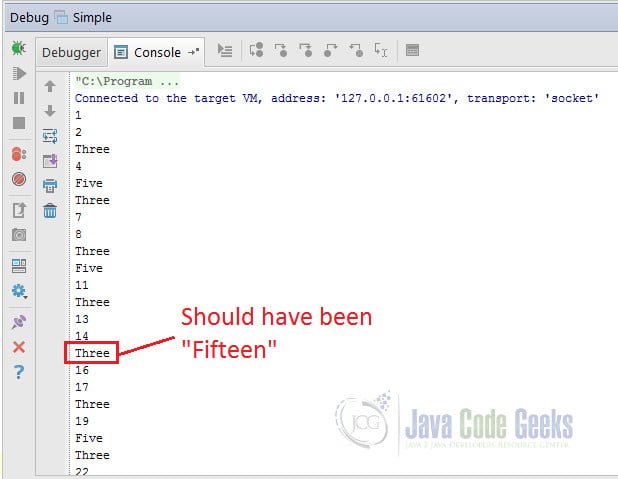
Let’s run the above program and check its output:
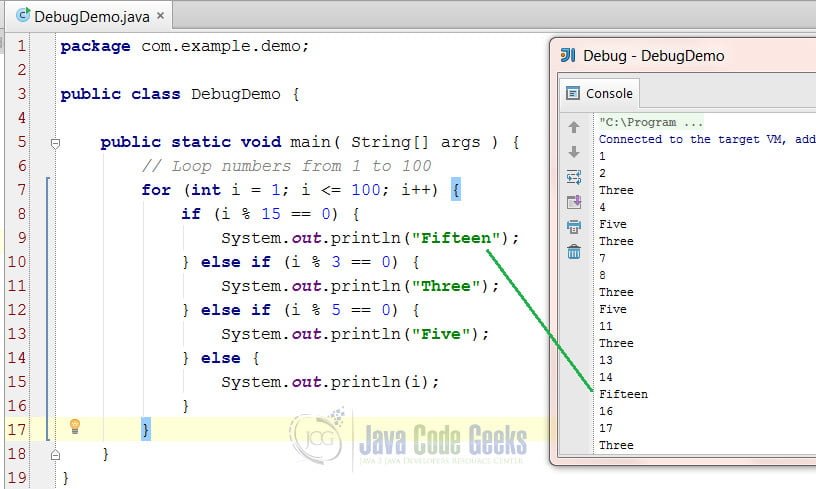
As you can see this program is printing “Three” where it should say “Fifteen”. Let’s debug the application to find the root cause of this problem.
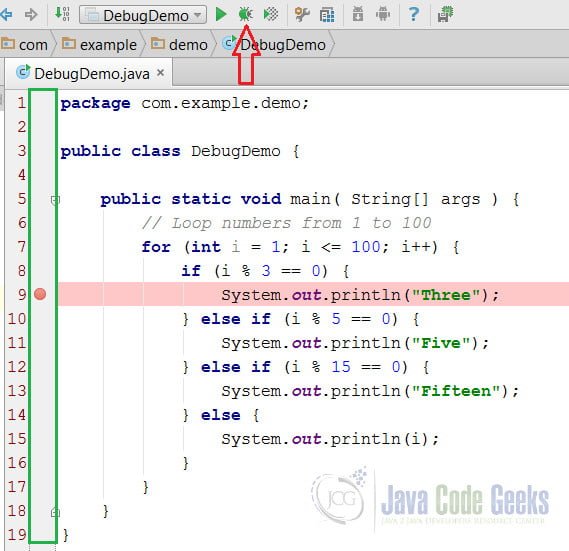
Breakpoints is an important word to learn and these are used to mark the source code where you want to suspend the execution of your program. You can place as many breakpoints as required by clicking on the area marked in Green. IntelliJ highlights the statement and shows red dots where you have placed breakpoints. At this point of time, you are ready to debug the code and you can do this by pressing the keys Shift + F9 or by clicking the tool marked by red arrow.
On encountering the first breakpoint in the code execution flow, IntelliJ suspends the application. You will notice that the color of the line has turned blue from red.
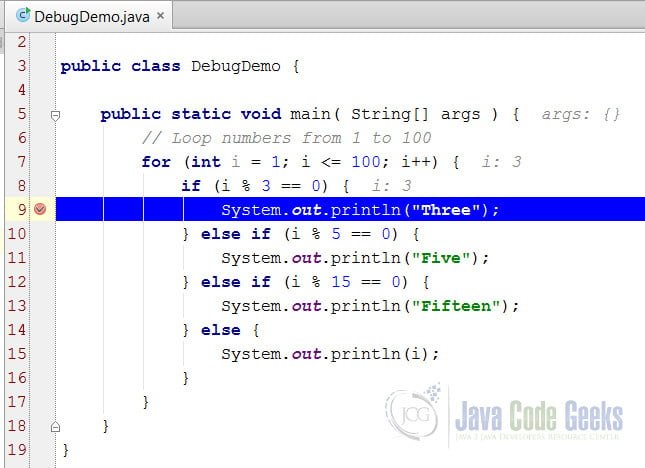
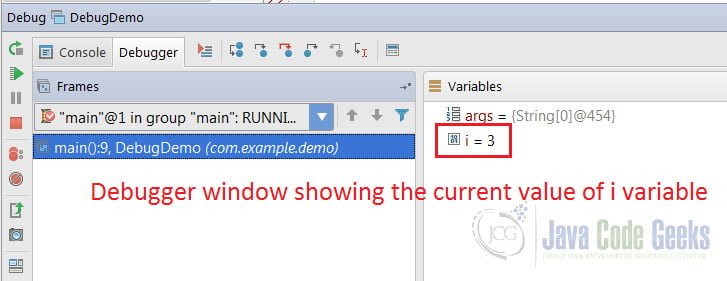
At this point, IntelliJ will show the debug tool window in the lower part and you will be able to float it to anywhere else on the screen as per your convenience. The IDE shows the method name and line number at which the program execution has been halted. Additionally, the variables panel displays the current state of all the available variables.
You also have the option to evaluate the value of any expressions. For example, if you want to know the value of i % 3, select this piece of code and right click. Choose Evaluate Expression and a pop-up window will be opened. At the bottom, you will see the Evaluate button using which you can check the current value of the expression.
You may also check the console window to see the output so far.
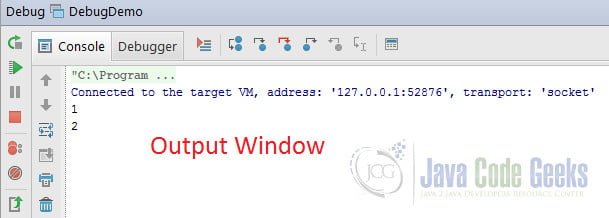
So far, the program has written 1 and 2 to the output window and it has correctly entered the if section of the program because 3 divided by 3 is 0. Now, you may step into (press F7) or step over (press F8) or simply resume the execution (press F9) using the keys or tools marked in green and red.
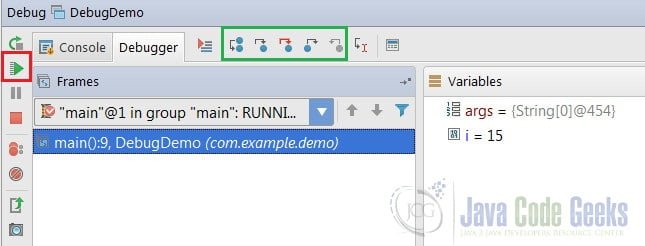
As we are more interested in the wrong output for 15, let’s resume the program. The execution of the program will be suspended when the value of variable i is 6, 9 , 12 and so on. At 15, you will notice the flaw in above logic. Because only one of the if…elseIf…else section executes for a given condition, the condition for divisibility by 15 must be check before checking the divisibility by 3 and 5. Once you restructure the if…else blocks, the program starts running as expected.
5. Summary
In the above example, I have demonstrated how you can leverage the power of debugging tools of IntelliJ IDEA. It’s a famous saying that “Necessity is the mother of invention”. For developers, the debugging feature of IDEs is one of the most important invention.
6. Download the Source Code
That was an example of the IntelliJ IDEA Debug Java Application.
You can download the full source code of this example here: Debugger

