1. Introduction
Java application performance tuning is a complex subject. There are many articles and books dedicated on the details and research of performance tuning. There is no silver bullet and often fixing performance issues is a long and tedious process. This article attempts to suggest a few pointers to get started with performance tuning and discusses one tool for profiling Java applications.
This article references JDK 8, Eclipse.
2. Getting Started
Non-functional requirements, particularly performance, are often overlooked during design and coding phases. It is critical to ensure that system architects, designers and developers keep performance requirements in mind while working on the application.
To get started with performance tuning, measure performance by scientifically recording the application performance for the key application flows both under normal expected system load and with increased load to stress test mission critical applications. Once the application performance has been recorded, we should look at fixing issues focusing on the most critical issues first, and then measure the application performance again. This process needs to be repeated until we meet the expected performance standards.
3. Using a profiling tool
There are many profiling tools available. JVisualVM is bundled with the latest versions of Java and is available under JDK\bin directory. In my experience, I have found java mission control to be useful as well (It is free to use in development environment).
Let’s take a basic java class to profile (you may pick any java class or project to profile):
SimulateObjectCreation.java
public class SimulateObjectCreation {
	public static void main(String[] args) {
		for (int i = 0; i < 10000000; i++) {
			System.out.println(i);
			String s = new String("temp" + i);
		}
	}
}
Java Mission Control screen:
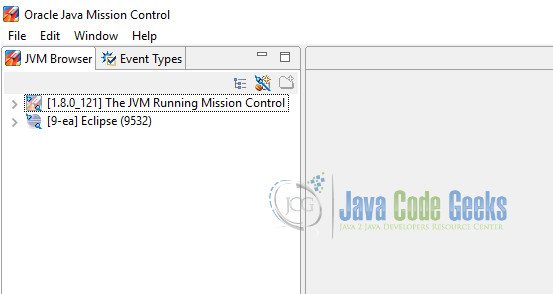
Eclipse has plugin available for Java Mission Control.
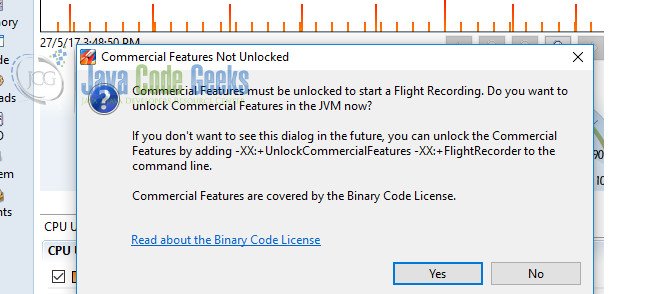
When you start java mission control recording, it may prompt about commercial features that may be applicable for production. JMC automatically picks up any running application and it can be recorded via the flight recording option in JMC.
The JMC recordings look like the below screenshots.
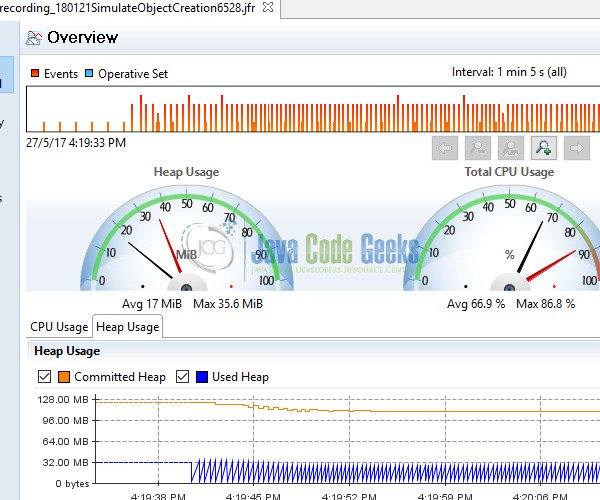
Mission control recordings allow us to look at the memory usage and profile of the application and helps in identifying bottlenecks and identify possible solutions. More details can be found here.
4 How to tune an application
4.1 Look for issues in code
This may seem straightforward but it often isn’t. Often developers overlook code optimizations that can be done. There are many tools available to find bugs in code and analyse static code. It is recommended to do a code review of the code/ methods picked up by the profiling tool. This can often unearth potential improvements in code via use of better data structures, cleaner code, more suited algorithms etc. As an example, a simple change of often concatenated strings via StringBuilder may be faster than using String class. Similarly, if concurrency is not expected, StringBuilder may be faster than use of StringBuffer. Such recommendations can be made by reviewing the code and having coding best practices and standards set for the team.
4.2 Threading
If implemented wisely and correctly, multi-threading can give a performance boost to the application by allowing multiple threads to work on activities in parallel. It is highly recommended to use multiple threads when possible while ensuring to take care of race conditions by using suitable synchronization techniques and avoid deadlocks.
At the infrastructure level, we can load balance the application to provide improved performance and scalability.
4.3 JDK upgrades
With newer versions of JDK, many JDK classes and methods have been re-written. At the time of writing of this article, JDK 8 had lot of changes to the JDK class internals whereby calling the same method in JDK 8 could potentially be faster than calling the method in JDK 6. Upgrading JDK is recommended to use the newer features, improved garbage collection, new JDK classes and better compilers.
4.4 Caching
It is recommended to add a caching layer for database calls for reference data and any data that doesn’t change often. This helps in reducing the network calls to hit database and may help in improving system performance.
4.5 Garbage Collection
Java comes with in-built garbage collectors. GC pause times and cycles are important as a full GC could mean a stop the world GC and halt application processing depending on the GC and the JDK being used. GC logging must be enabled during application runs and profiled using tools like GCViewer during application peak times to look for potential improvements in GC parameters and type of GC.
5. Summary
There is a lot more to performance tuning. This article aims at providing a starting point. Performance tuning is often a tedious process that requires meticulous planning, understanding and analysis of code and the underlying software and infrastructure.
6. References
- http://www.oracle.com/technetwork/java/javaseproducts/mission-control/java-mission-control-1998576.html
- Java Performance Tuning, Jack Shirazi
