In this article, we’re going to see a thread dump in Java. What are the tools available to analyze and make our own code to do that?
1. Introduction
A thread dump is a snapshot of the state of all the threads of a Java process. Also, it reveals information about an application’s thread activity that can help us diagnose problems and optimize application and JVM performance.
As an example, thread dumps automatically show the occurrence of a deadlock.
Following, we’ll discuss some tools present in JDK Utilities and create an example on code.
2. Pre-requisites
The minimum recommended Java version to use the article’s tools is JDK 8 (find here), but we can use the most recently released Java version (JDK 15).
Also, I’m using IntelliJ 2020.2 to write and execute the code example, but feel free to use any IDE with support for the versions recommended above.
3. JDK Tools and Utilities
The JDK provides several tools and utilities that can capture the thread dump of a Java application. These tools are located in the bin folder of the JDK home directory.
3.1 jstack
jstack is a command-line JDK utility we can use to capture a thread dump. It takes the PID of a process and displays the thread dump in the console.
Using a terminal, let’s execute the command below to see what options jstack brings:
jstack options
$jstack --help
Usage:
    jstack [-l]
        (to connect to running process)
    jstack -F [-m] [-l]
        (to connect to a hung process)
    jstack [-m] [-l]
        (to connect to a core file)
    jstack [-m] [-l] [server_id@]
        (to connect to a remote debug server)

Options:
    -F  to force a thread dump. Use when jstack  does not respond (process is hung)
    -m  to print both java and native frames (mixed mode)
    -l  long listing. Prints additional information about locks
    -h or -help to print this help message
The following example executes and save the dump in an output file.
jstack example
$ jstack 9199 > ~/Temp/output.txt
And the beginning of output.txt file.
output file example
2021-01-17 17:47:31
Full thread dump Java HotSpot(TM) 64-Bit Server VM (25.181-b13 mixed mode):

"Attach Listener" #581 daemon prio=9 os_prio=31 tid=0x00007f9a9ab95000 nid=0x951f waiting on condition [0x0000000000000000]
   java.lang.Thread.State: RUNNABLE
3.2 Java Mission Control (JMC)
Java Mission Control (JMC) is a GUI tool that collects and analyzes data from Java applications.
For some bug reasons, I recommend to download this JMC version from Oracle to run JMC properly.
With JMC opened, on the left side we can see the Java process that are running on our machine.
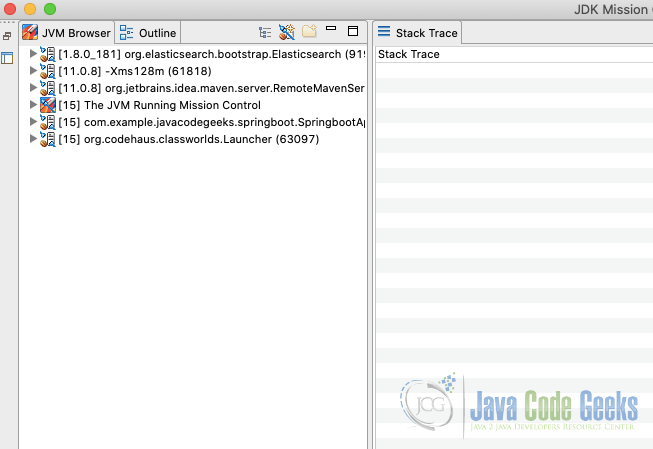
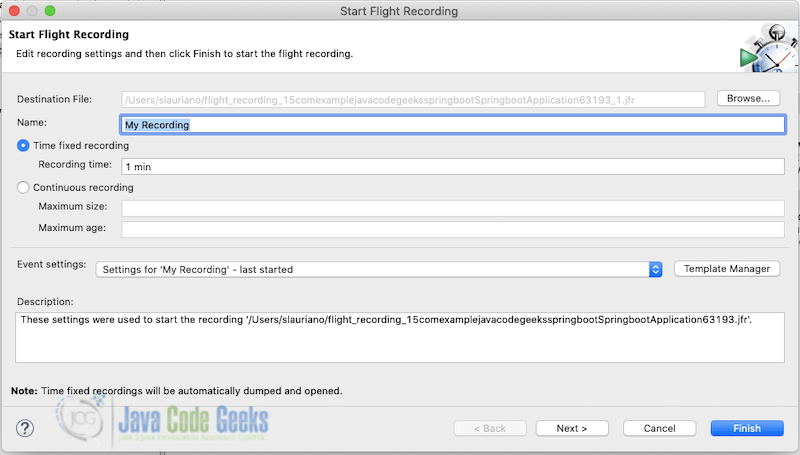
We can right-click on the process and click Start Flight Recording. A pop-up window will appear and we can choose where to save the dump and how much time this record will save.
After the recording has finished, the windows with details about the process will appear in the JMC
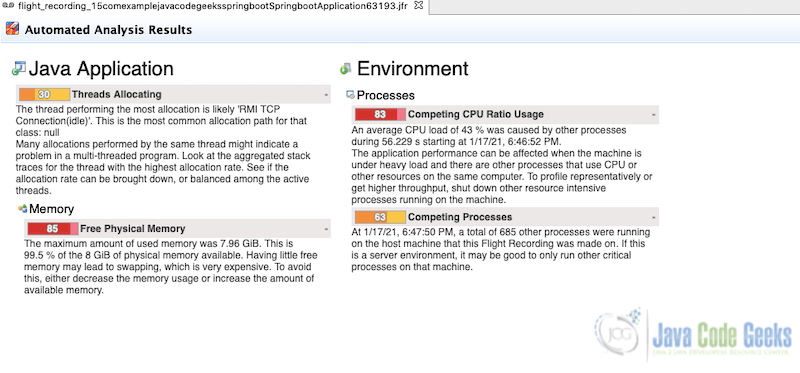
By choosing the Outline tab in the left menu, we can see details about the threads.

Important note: Java Mission Control requires a commercial license for use in production.
3.3 jvisualvm
Java VisualVM (jvisualvm) is an intuitive graphical user interface that provides detailed information about Java applications while they are running on a specified Java Virtual Machine (JVM).
To use it, just open an terminal and type jvisualvm (JDK 8).
We can start the thread dump just right click in the Java application and choose the option “Thread”.

Since JDK 9, jvisualvm is not included in Oracle JDK and OpenJDK distribution. Therefore, if we want to use with JDK 9 or higher versions, we can get it on the Visual VM open source site.
3.4 jcmd
The jcmd utility is used to send diagnostic command requests to the JVM, where these requests are useful for controlling Java Flight Recordings, troubleshoot, and diagnose JVM and Java Applications.
An disadvantage of this tools is that doesn’t contain any remote functionality, so we can only use in the local machine where the Java process is running.
The command Thread.print can be used to thread dump just by passing the PID or main class of the Java process as below:
jcmd example
$ jcmd 59891 Thread.print -> with PID
$ jcmd com.example.javacodegeeks.springboot.SpringbootApplication Thread.print -> with main class
We can also save the dump in an output file as following:
jcmd output file
$ jcmd 59891 Thread.print > ~/Temp/output.txt
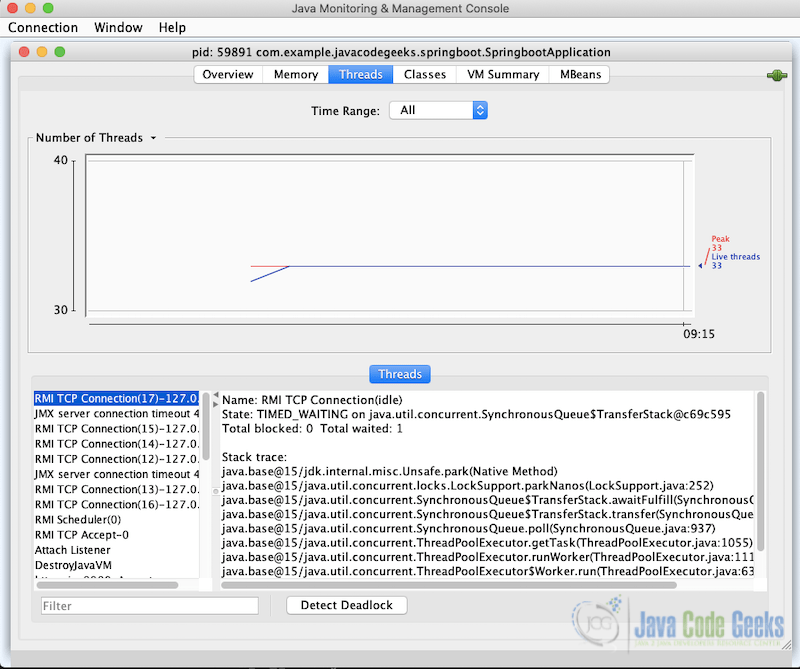
3.5 jconsole
The jconsole graphical user interface is a monitoring tool that complies to the Java Management Extensions (JMX) specification.
Also, jconsole uses the extensive instrumentation of the Java Virtual Machine (Java VM) to provide information about the performance and resource consumption of applications running on the Java platform.
On the terminal, just type jconsole to start the window below where we can choose our Java process to dump:
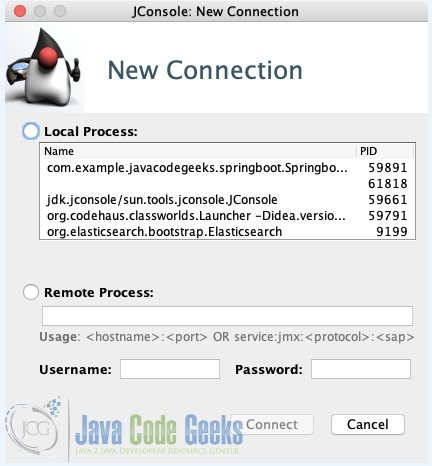
When the connection is stablished, we can see on “Thread” tab all the Java process thread running. Select one to see the current dump on the screen.
4. Server Command line
In enterprise application servers, only the JRE is installed for security reasons. Therefore, we can not use the above-mentioned tools as they are part of JDK.
However, there are a lot of command-line alternatives that allow us capture thread dumps easily.
4.1 Kill command (Linux/Unix)
The kill command in Linux/Unix systems is the easiest way to capture a thread dump. Using the signal -3 with the kill command ,we’ll send to the Java process an instruction to print the standard thread dump output.
kill command example
$ kill -3 59791
If we run the Java process with the following combination of tuning flags, then it will also redirect the thread dump to the given file:
Java tuning flags
-XX:+UnlockDiagnosticVMOptions -XX:+LogVMOutput -XX:LogFile=~/output.log
Now if we send the -3 signal, in addition to the standard output, the dump will be available at ~/output.log file.
4.2 Ctrl + Break (Windows)
In Windows operating systems, we can capture a thread dump using the Ctrl and Break key combination. To take a thread dump, navigate to the console used to launch the Java application and press Ctrl+Break keys together.
In some keyboards, the Break key is not available. Therefore, in such cases, a thread dump can be captured using Ctrl, Shift and Pause keys together.
Both of these commands print the thread dump to the console.
5. Capturing Programmatically
Below it’s an example using ThreadMXBean to capture the thread dump.
ThreadMxBean example
private static void threadDump(boolean lockedMonitors, boolean lockedSynchronizers) throws IOException, IOException {
        Path threadDumpFile = Paths.get("ThreadDumpOutput.txt");

        StringBuffer threadDump = new StringBuffer(System.lineSeparator());
        ThreadMXBean threadMXBean = ManagementFactory.getThreadMXBean();
        for(ThreadInfo threadInfo : threadMXBean.dumpAllThreads(lockedMonitors, lockedSynchronizers)) {
            threadDump.append(threadInfo.toString());
        }
        Files.write(threadDumpFile, threadDump.toString().getBytes());
    }
In the code above we see some steps to dump into a file called ThreadDumpOutuput.txt. Let’s see in detail:
- StringBuffer created to manage information fro each thread.
- Using
ManagementFactoryto initialize aThreadMXBeaninstance. TheManagementFactoryclass gets the managed beans for Java platform. Also,ThreadMXBeanis the management interface for thread system of the JVM. - Setting lockedMonitors and lockedSynchronizers values to true indicates to capture the synchronizers and all locked monitors in the thread dump.
- Finally, insert all data in the StringBuffer and put in the file.
6. Conclusion
In conclusion, we see in this article a few tools to deal with thread dumps in Java. Some of them are easily to work in a friendly interface and mostly part of JDK package.
Further, we can take a look in a simple code example to do our own thread dump into our Java applications.
7. Download the source code
You can download the full source code of this example here: Java Thread Dump
