
Through this article, we are going to show you how to create a stock Candlestick chart using JFreeChart, JFreeChart is a free open source Java library for generating charts, it includes a wide range of charts such as pie charts, bar charts, line charts, scatter plots, time series charts (including moving averages, high-low-open-close charts and candlestick plots), Gantt charts, meter charts (dial and thermometer), combination charts and more.
Also, this example will demonstrate the combined charts facility of JFreeChart, it provides a flexible mechanism for combining multiple plots on a single chart. A combined XY plot is a plot that has two or more subplots sharing either the horizontal or the vertical axis.
To demonstrate, we will create a candlestick combined with volume chart. This is a common type of chart used in the finance industry. It is used to plot the (High, Low, Open, Close) prices of specific stock, along with the stock’s trading volume (the number of units traded) based on intraday financial market trades.
1. Project Environment
- JfreeChart 1.0.13
- Apache Maven 3.0.5
- JDK 1.8
- Eclipse 4.4 (Luna)
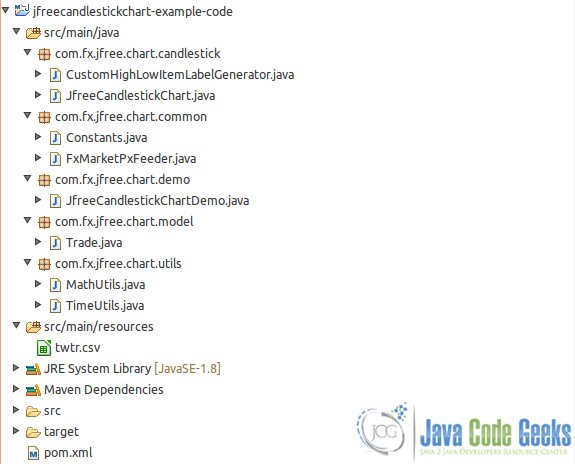
2. Project Structure
We create a simple Java Maven project with the following structure.
3. Dependencies
We have the following dependencies inside our below POM file.
pom.xml:
<project xmlns="http://maven.apache.org/POM/4.0.0" xmlns:xsi="http://www.w3.org/2001/XMLSchema-instance"
	xsi:schemaLocation="http://maven.apache.org/POM/4.0.0 http://maven.apache.org/xsd/maven-4.0.0.xsd">
	<modelVersion>4.0.0</modelVersion>

	<groupId>com.jcg.example</groupId>
	<artifactId>jfreecandlestickchart-example-code</artifactId>
	<version>1.0</version>
	<packaging>jar</packaging>
	<name>jfreecandlestickchart-example-code</name>

	<properties>
		<!-- Generic properties -->
		<java.version>1.8</java.version>
	</properties>

	<dependencies>
		<dependency>
			<groupId>jfree</groupId>
			<artifactId>jfreechart</artifactId>
			<version>1.0.13</version>
		</dependency>
	</dependencies>

	<build>
		<plugins>
			<plugin>
				<artifactId>maven-compiler-plugin</artifactId>
				<version>3.2</version>
				<configuration>
					<source>${java.version}</source>
					<target>${java.version}</target>
				</configuration>
			</plugin>
			<plugin>
				<artifactId>maven-assembly-plugin</artifactId>
				<version>2.5.3</version>
				<executions>
					<execution>
						<phase>package</phase>
						<goals>
							<goal>single</goal>
						</goals>
					</execution>
				</executions>
				<configuration>
					<archive>
						<manifest>
							<mainClass>com.fx.jfree.chart.demo.JfreeCandlestickChartDemo</mainClass>
						</manifest>
					</archive>
					<descriptorRefs>
						<descriptorRef>jar-with-dependencies</descriptorRef>
					</descriptorRefs>
					<finalName>${project.name}</finalName>
					<appendAssemblyId>false</appendAssemblyId>
				</configuration>
			</plugin>
		</plugins>
	</build>

</project>
4. Constructing the Jfree Candlestick Chart
To create a Jfree combined chart, you should create the below components:
- Candlestick subplot
- Volume subplot
- Chart main plot to combine
candlestickandvolumesubplots - JFreeChart with previously created main plot
We have used the OHLCSeriesCollection class to represent both the Candlestick dataset. However, we used the TimeSeriesCollection class to represent the volume dataset. These datasets will be updated using the method addCandel(long time, double o, double h, double l, double c, long v) of JfreeCandlestickChart.java class.
Notice how each of the subplots has a null domain axis, since they share the parent plot’s axis.
Also, the combined plot is created with a VERTICAL orientation, which means that the sub-plots are stacked from top to bottom. You can control the amount of space allocated to each plot by specifying a weight for each plot as you add them to the parent plot where each plot is allocated space based on its weight as a percentage of the total.
In our example, the first subplot is allocated 3/4 of the space, and the second subplot is allocated 1/4 of the space.
JfreeCandlestickChart.java:
package com.fx.jfree.chart.candlestick;

import java.awt.BorderLayout;
import java.awt.Color;
import java.text.DateFormat;
import java.text.DecimalFormat;
import java.text.ParseException;
import java.text.SimpleDateFormat;

import javax.swing.JPanel;

import org.jfree.chart.ChartPanel;
import org.jfree.chart.JFreeChart;
import org.jfree.chart.axis.DateAxis;
import org.jfree.chart.axis.NumberAxis;
import org.jfree.chart.labels.StandardXYToolTipGenerator;
import org.jfree.chart.plot.CombinedDomainXYPlot;
import org.jfree.chart.plot.PlotOrientation;
import org.jfree.chart.plot.XYPlot;
import org.jfree.chart.renderer.xy.CandlestickRenderer;
import org.jfree.chart.renderer.xy.XYBarRenderer;
import org.jfree.data.time.FixedMillisecond;
import org.jfree.data.time.TimeSeries;
import org.jfree.data.time.TimeSeriesCollection;
import org.jfree.data.time.ohlc.OHLCSeries;
import org.jfree.data.time.ohlc.OHLCSeriesCollection;

import com.fx.jfree.chart.model.Trade;
import com.fx.jfree.chart.utils.MathUtils;
import com.fx.jfree.chart.utils.TimeUtils;

/**
 * The Class JfreeCandlestickChart.
 *
 * @author ashraf
 */
@SuppressWarnings("serial")
public class JfreeCandlestickChart extends JPanel {

	private static final DateFormat READABLE_TIME_FORMAT = new SimpleDateFormat("kk:mm:ss");

	private OHLCSeries ohlcSeries;
	private TimeSeries volumeSeries;

	private static final int MIN = 60000;
	// Every minute
	private int timeInterval = 1;
	private Trade candelChartIntervalFirstPrint = null;
	private double open = 0.0;
	private double close = 0.0;
	private double low = 0.0;
	private double high = 0.0;
	private long volume = 0;

	public JfreeCandlestickChart(String title) {
		// Create new chart
		final JFreeChart candlestickChart = createChart(title);
		// Create new chart panel
		final ChartPanel chartPanel = new ChartPanel(candlestickChart);
		chartPanel.setPreferredSize(new java.awt.Dimension(1200, 500));
		// Enable zooming
		chartPanel.setMouseZoomable(true);
		chartPanel.setMouseWheelEnabled(true);
		add(chartPanel, BorderLayout.CENTER);
	}

	private JFreeChart createChart(String chartTitle) {

		/**
		 * Creating candlestick subplot
		 */
		// Create OHLCSeriesCollection as a price dataset for candlestick chart
		OHLCSeriesCollection candlestickDataset = new OHLCSeriesCollection();
		ohlcSeries = new OHLCSeries("Price");
		candlestickDataset.addSeries(ohlcSeries);
		// Create candlestick chart priceAxis
		NumberAxis priceAxis = new NumberAxis("Price");
		priceAxis.setAutoRangeIncludesZero(false);
		// Create candlestick chart renderer
		CandlestickRenderer candlestickRenderer = new CandlestickRenderer(CandlestickRenderer.WIDTHMETHOD_AVERAGE,
				false, new CustomHighLowItemLabelGenerator(new SimpleDateFormat("kk:mm"), new DecimalFormat("0.000")));
		// Create candlestickSubplot
		XYPlot candlestickSubplot = new XYPlot(candlestickDataset, null, priceAxis, candlestickRenderer);
		candlestickSubplot.setBackgroundPaint(Color.white);

		/**
		 * Creating volume subplot
		 */
		// creates TimeSeriesCollection as a volume dataset for volume chart
		TimeSeriesCollection volumeDataset = new TimeSeriesCollection();
		volumeSeries = new TimeSeries("Volume");
		volumeDataset.addSeries(volumeSeries);
		// Create volume chart volumeAxis
		NumberAxis volumeAxis = new NumberAxis("Volume");
		volumeAxis.setAutoRangeIncludesZero(false);
		// Set to no decimal
		volumeAxis.setNumberFormatOverride(new DecimalFormat("0"));
		// Create volume chart renderer
		XYBarRenderer timeRenderer = new XYBarRenderer();
		timeRenderer.setShadowVisible(false);
		timeRenderer.setBaseToolTipGenerator(new StandardXYToolTipGenerator("Volume--> Time={1} Size={2}",
				new SimpleDateFormat("kk:mm"), new DecimalFormat("0")));
		// Create volumeSubplot
		XYPlot volumeSubplot = new XYPlot(volumeDataset, null, volumeAxis, timeRenderer);
		volumeSubplot.setBackgroundPaint(Color.white);

		/**
		 * Create chart main plot with two subplots (candlestickSubplot,
		 * volumeSubplot) and one common dateAxis
		 */
		// Creating charts common dateAxis
		DateAxis dateAxis = new DateAxis("Time");
		dateAxis.setDateFormatOverride(new SimpleDateFormat("kk:mm"));
		// reduce the default left/right margin from 0.05 to 0.02
		dateAxis.setLowerMargin(0.02);
		dateAxis.setUpperMargin(0.02);
		// Create mainPlot
		CombinedDomainXYPlot mainPlot = new CombinedDomainXYPlot(dateAxis);
		mainPlot.setGap(10.0);
		mainPlot.add(candlestickSubplot, 3);
		mainPlot.add(volumeSubplot, 1);
		mainPlot.setOrientation(PlotOrientation.VERTICAL);

		JFreeChart chart = new JFreeChart(chartTitle, JFreeChart.DEFAULT_TITLE_FONT, mainPlot, true);
		chart.removeLegend();
		return chart;
	}

	/**
	 * Fill series with data.
	 *
	 * @param t the t
	 */
	public void addCandel(long time, double o, double h, double l, double c, long v) {
		try {
			// Add bar to the data. Let's repeat the same bar
			FixedMillisecond t = new FixedMillisecond(
					READABLE_TIME_FORMAT.parse(TimeUtils.convertToReadableTime(time)));
			ohlcSeries.add(t, o, h, l, c);
			volumeSeries.add(t, v);
		} catch (ParseException e) {
			e.printStackTrace();
		}
	}


	/**
	 * Aggregate the (open, high, low, close, volume) based on the predefined time interval (1 minute)
	 *
	 * @param t the t
	 */
	public void onTrade(Trade t) {
		double price = t.getPrice();
		if (candelChartIntervalFirstPrint != null) {
			long time = t.getTime();
			if (timeInterval == (int) ((time / MIN) - (candelChartIntervalFirstPrint.getTime() / MIN))) {
				// Set the period close price
				close = MathUtils.roundDouble(price, MathUtils.TWO_DEC_DOUBLE_FORMAT);
				// Add new candle
				addCandel(time, open, high, low, close, volume);
				// Reset the intervalFirstPrint to null
				candelChartIntervalFirstPrint = null;
			} else {
				// Set the current low price
				if (MathUtils.roundDouble(price, MathUtils.TWO_DEC_DOUBLE_FORMAT)  high)
					high = MathUtils.roundDouble(price, MathUtils.TWO_DEC_DOUBLE_FORMAT);

				volume += t.getSize();
			}
		} else {
			// Set intervalFirstPrint
			candelChartIntervalFirstPrint = t;
			// the first trade price in the day (day open price)
			open = MathUtils.roundDouble(price, MathUtils.TWO_DEC_DOUBLE_FORMAT);
			// the interval low
			low = MathUtils.roundDouble(price, MathUtils.TWO_DEC_DOUBLE_FORMAT);
			// the interval high
			high = MathUtils.roundDouble(price, MathUtils.TWO_DEC_DOUBLE_FORMAT);
			// set the initial volume
			volume = t.getSize();
		}
	}

}
Also, we created FxMarketPxFeeder.java class which will be played as the financial market data feeder, it reads our trades file twtr.csv which contains the intraday trades for Twitter stock, it feeds the JfreeCandlestickChart.java using the callback method onTrade(Trade t) to Aggregate the (open, high, low, close, volume) based on the predefined time interval (1 minute). then, it updates the JfreeCandlestickChart using the addCandel(long time, double o, double h, double l, double c, long v) method.
FxMarketPxFeeder.java:
package com.fx.jfree.chart.common;

import java.io.BufferedReader;
import java.io.IOException;
import java.io.InputStreamReader;
import java.util.concurrent.ExecutorService;
import java.util.concurrent.Executors;

import com.fx.jfree.chart.candlestick.JfreeCandlestickChart;
import com.fx.jfree.chart.model.Trade;
import com.fx.jfree.chart.utils.TimeUtils;


/**
 * The Class FxMarketPxFeeder.
 *
 * @author ashraf
 */
public class FxMarketPxFeeder {

	private JfreeCandlestickChart jfreeCandlestickChart;
	private String stockTradesFile;
	private int simulationTime;
	private ExecutorService executorService;

	public FxMarketPxFeeder(JfreeCandlestickChart jfreeCandlestickChart, String stockTradesFile, int simulationTime) {
		super();
		this.executorService = Executors.newCachedThreadPool();
		this.stockTradesFile = stockTradesFile;
		this.jfreeCandlestickChart = jfreeCandlestickChart;
		this.simulationTime = simulationTime;
	}

	public void run() {
		executorService.execute(() -> read());
	}

	private void read() {
		try (BufferedReader br = new BufferedReader(
				new InputStreamReader(this.getClass().getResourceAsStream(stockTradesFile)))) {
			while (true) {
				Thread.sleep(simulationTime);
				String line = br.readLine();
				if (line != null) {
					// Parse line and convert it to trade
					String[] tradeElements = line.split(Constants.DELIMITER);
					Trade t = new Trade(tradeElements[Constants.STOCK_IDX],
							TimeUtils.convertToMillisTime(tradeElements[Constants.TIME_IDX]),
							Double.parseDouble(tradeElements[Constants.PRICE_IDX]),
							Long.parseLong(tradeElements[Constants.SIZE_IDX]));
					// Add trade to the jfreeCandlestickChart
					jfreeCandlestickChart.onTrade(t);
				} else {
					executorService.shutdown();
					break;
				}
			}
		} catch (IOException e) {
			e.printStackTrace();
		} catch (InterruptedException e) {
			e.printStackTrace();
		}

	}

}
Notice that twtr.csv file contains the intraday Twitter stock trades, each trade has stock, time, price and shares.
twtr.csv:
TWTR|09:30:00.000|64.890|100
TWTR|09:30:00.000|64.890|25
TWTR|09:30:00.000|64.890|245
TWTR|09:30:00.000|64.890|55
TWTR|09:30:00.425|64.890|500
TWTR|09:30:00.425|64.900|100
TWTR|09:30:00.700|64.960|200
TWTR|09:30:00.700|64.950|50
TWTR|09:30:00.700|64.950|50
TWTR|09:30:04.375|65.000|163399
TWTR|09:30:04.375|64.960|100
TWTR|09:30:04.375|64.960|100
TWTR|09:30:04.375|64.960|100
TWTR|09:30:04.375|64.970|100
TWTR|09:30:04.375|64.970|300
TWTR|09:30:04.375|64.970|190
TWTR|09:30:04.375|64.970|100
TWTR|09:30:04.425|64.960|400
TWTR|09:30:04.425|64.970|10
TWTR|09:30:04.425|64.970|90
5. Running the Jfree Candlestick Chart
We create JfreeCandlestickChartDemo.java class which serve as main class to running our example.
JfreeCandlestickChartDemo.java:
package com.fx.jfree.chart.demo;

import javax.swing.JFrame;
import javax.swing.JPanel;
import javax.swing.SwingUtilities;

import com.fx.jfree.chart.candlestick.JfreeCandlestickChart;
import com.fx.jfree.chart.common.FxMarketPxFeeder;

/**
 * The Class JfreeCandlestickChartDemo.
 *
 * @author ashraf
 */
@SuppressWarnings("serial")
public class JfreeCandlestickChartDemo extends JPanel {

    /**
     * Create the GUI and show it.  For thread safety,
     * this method should be invoked from the
     * event-dispatching thread.
     */
    private static void createAndShowGUI() {
        //Make sure we have nice window decorations.
        JFrame.setDefaultLookAndFeelDecorated(true);

        //Create and set up the window.
        JFrame frame = new JFrame("JfreeCandlestickChartDemo");
        frame.setDefaultCloseOperation(JFrame.EXIT_ON_CLOSE);

        //Create and set up the chart.
        JfreeCandlestickChart jfreeCandlestickChart = new JfreeCandlestickChart("TWTR");
        new FxMarketPxFeeder(jfreeCandlestickChart, "/twtr.csv", 2).run();
        frame.setContentPane(jfreeCandlestickChart);

        //Disable the resizing feature
        frame.setResizable(false);
        //Display the window.
        frame.pack();
        frame.setVisible(true);
    }

    public static void main(String[] args) {
        //creating and showing this application's GUI.
        SwingUtilities.invokeLater(new Runnable() {
            public void run() {
                createAndShowGUI();
            }
        });
    }
}
Output:

6. Download the Source Code
This was an example to show how to create a Jfree candlestick chart.
You can download the full source code of this example here: JfreeCandlestickChartExampleCode.zip



Hi, Thanks for the demo. I ran it ok in eclipse, but the chart is very slow to construct. I wanted to try running it from the CLI but I get errors about missing packages and symbols. I think I need to list the class paths in the command but can’t work it out. Any recommendations?
Thanks
Hi. Here is class Trade. Where is description of this class? I couldn’t find it ((