Vaadin charts are beautiful eye candy charts to enrich your applications. Using Vaadin charts could make the difference when you need to sell the application to the end user.
1. The tools
- Java JDK 8
- Latest Eclipse Mars
- Vaadin plugin for eclipse
- Vaadin charts
2. Introduction
Vaadin charts offer more than twenty kinds of charts. You can find for sure a chart to fill your needs in data presentation UI, the charts are very easy to use and use html5 and there is no need to install any plug-ins and you can use it directly from Java. In this example I am going to show how to configure the Vaadin Charts in eclipse using Ivy and make four charts of different kinds.
3. Prerequisites
- JDK installed
- Eclipse Mars installed and working
- Vaadin plugin installed and working
4. Set up the project
In the file menu choose File -> New -> Other
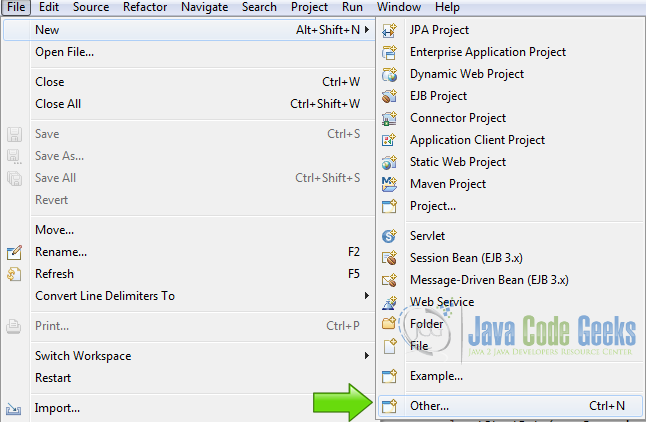
Now from the list choose Vaadin 7 project:
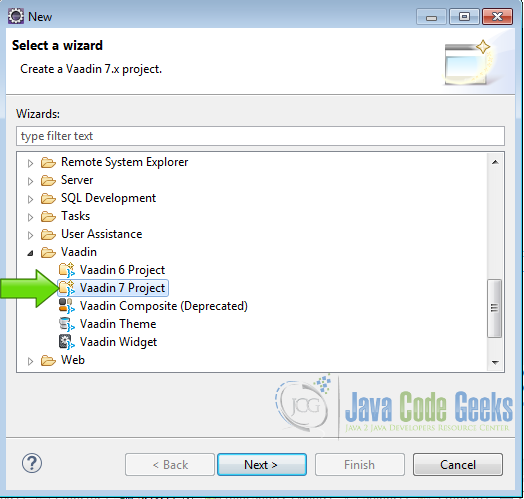
Hit next and name your project then hit finish.
5. Set up Vaadin Charts
5.1 The license
Go to the Vaadin website and sing up to get an evaluation license vaadin.charts.developer.license of Vaadin Charts, download the license and put it in your home directory. If you are in Windows, you home directory is on C:\Users\Username, on Linux and OSX your home directory is ~/. Just put the license there and you are fine.
5.2 The repositories
Now to get the Vaadin charts jar, you need to get the jar from the Maven repository,here I am using Ivy for that task so edit the file ivy.xml in the root of your project and add the following node into the dependencies node.
Vaadin Charts dependency
		<dependency
		   org="com.vaadin.addon"
		   name="vaadin-charts"
		   rev="3.0.0-beta1" />
Now the ivy.xml should look like this:
ivy.xml
<?xml version="1.0"?>
<!DOCTYPE ivy-module [
	<!ENTITY vaadin.version "7.6.3">
]>
<ivy-module version="2.0"
	xmlns:xsi="http://www.w3.org/2001/XMLSchema-instance"
	xsi:noNamespaceSchemaLocation="http://ant.apache.org/ivy/schemas/ivy.xsd">
	<info organisation="com.example" module="v7proj" />
	<configurations>
		<!-- The default configuration, which should be deployed to the server -->
		<conf name="default" />
		<!-- A configuration only needed when compiling the widget set. Should
			not be deployed to the server -->
		<conf name="widgetset-compile" />
		<!-- A configuration used in compilation of server side classes only.
			Should be deployed to the server -->
		<conf name="nodeploy" />
	</configurations>
	<dependencies defaultconf="default" defaultconfmapping="default->default">
		<!-- The core server part of Vaadin -->
		<dependency org="com.vaadin" name="vaadin-server" rev="&vaadin.version;" />

		<!-- Vaadin themes -->
		<dependency org="com.vaadin" name="vaadin-themes" rev="&vaadin.version;" />

		<!-- Push support -->
		<dependency org="com.vaadin" name="vaadin-push" rev="&vaadin.version;" />

		<!-- Servlet 3.0 API -->
		<dependency org="javax.servlet" name="javax.servlet-api" rev="3.0.1" conf="nodeploy->default" />

		<!-- Precompiled DefaultWidgetSet -->
		<dependency org="com.vaadin" name="vaadin-client-compiled"
			rev="&vaadin.version;" />

		<!-- Vaadin client side, needed for widget set compilation -->
		<dependency org="com.vaadin" name="vaadin-client" rev="&vaadin.version;"
			 conf="widgetset-compile->default" />

		<!-- Compiler for custom widget sets. Should not be deployed -->
		<dependency org="com.vaadin" name="vaadin-client-compiler"
			rev="&vaadin.version;" conf="widgetset-compile->default" />

		<dependency
		   org="com.vaadin.addon"
		   name="vaadin-charts"
		   rev="3.0.0-beta1" />

	</dependencies>
</ivy-module>
6. Compile Widgetset
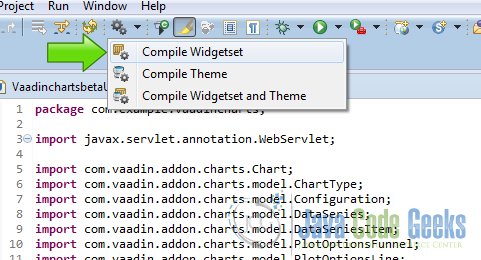
After you add the dependency, you need to compile the Vaadin widgetset in order to use the Vaadin charts, go to the Vaadin Menu in the eclipse toolbar and choose compile widgetset.
If everything is okay you should get something like this in the tail of the eclipse console output:
output console tail
   Compile of permutations succeeded
   Compilation succeeded -- 115,650s
Linking into
   Link succeeded
   Linking succeeded -- 0,973s
7. Coding the example
7.1 Init Method
Init Method
	protected void init(VaadinRequest request) {
		   final VerticalLayout layout = new VerticalLayout();
		   layout.setMargin(true);
		   setContent(layout);

		   HorizontalLayout line01 = new HorizontalLayout();
		   HorizontalLayout line02 = new HorizontalLayout();

		   line01.addComponent(getLineChart());
		   line01.addComponent(getWaterfallChart());
		   line02.addComponent(getPieChart());
		   line02.addComponent(getFunnelChart());
		   layout.addComponent(line01);
		   layout.addComponent(line02);
	}
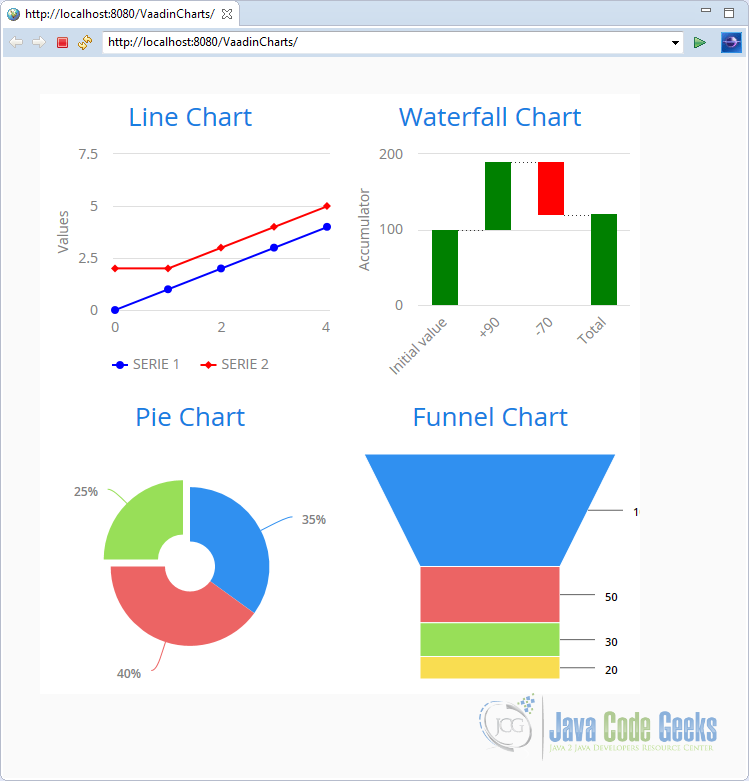
For the main view I created a vertical layout an inside the vertical layout I put two horizontal layouts to the four examples on a single page, every chart is inside a method for clarity.
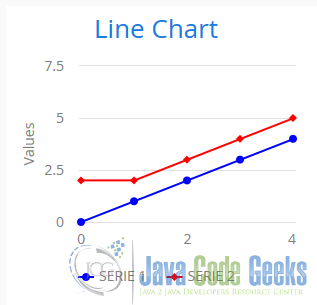
7.2 Line Chart
Line chart is a two dimensional chart that you can use to on a multiple scenarios.
First I create the chart and assign a fixed size of 300×300 pixels.
Create chart
	   Chart chart = new Chart();
	   chart.setWidth("300px");
	   chart.setHeight("300px");
Create a configuration Object to set the type of chart and the title.
Configuration
	   Configuration conf = chart.getConfiguration();
	   conf.getChart().setType(ChartType.LINE);
	   conf.setTitle("Line Chart");
Create the data to be show in the chart using a DataSeries object for that and then add the dataseries to the configuration of the chart.
Dataseries
	   DataSeries serie1 = new DataSeries("SERIE 1");
	   serie1.add(new DataSeriesItem(0,0));
	   serie1.add(new DataSeriesItem(1,1));
	   serie1.add(new DataSeriesItem(2,2));
	   serie1.add(new DataSeriesItem(3,3));
	   serie1.add(new DataSeriesItem(4,4));
	   conf.addSeries(serie1);

	   DataSeries serie2 = new DataSeries("SERIE 2");
	   serie2.add(new DataSeriesItem(0,2));
	   serie2.add(new DataSeriesItem(1,2));
	   serie2.add(new DataSeriesItem(2,3));
	   serie2.add(new DataSeriesItem(3,4));
	   serie2.add(new DataSeriesItem(4,5));
	   conf.addSeries(serie2);
With the PlotOptionsLine, I set the color of each line.
PlotOptionsLine
	   PlotOptionsLine serie1Opts = new PlotOptionsLine();
	   serie1Opts.setColor(SolidColor.BLUE);
	   serie1.setPlotOptions(serie1Opts);

	   PlotOptionsLine serie2Opts = new PlotOptionsLine();
	   serie2Opts.setColor(SolidColor.RED);
	   serie2.setPlotOptions(serie2Opts);
Here is the getLineChart() method.
Line Chart
private Chart getLineChart()
{
	   Chart chart = new Chart();
	   chart.setWidth("300px");
	   chart.setHeight("300px");
	   Configuration conf = chart.getConfiguration();
	   conf.getChart().setType(ChartType.LINE);
	   conf.setTitle("Line Chart");

	   DataSeries serie1 = new DataSeries("SERIE 1");
	   serie1.add(new DataSeriesItem(0,0));
	   serie1.add(new DataSeriesItem(1,1));
	   serie1.add(new DataSeriesItem(2,2));
	   serie1.add(new DataSeriesItem(3,3));
	   serie1.add(new DataSeriesItem(4,4));
	   conf.addSeries(serie1);
	   PlotOptionsLine serie1Opts = new PlotOptionsLine();
	   serie1Opts.setColor(SolidColor.BLUE);
	   serie1.setPlotOptions(serie1Opts);

	   DataSeries serie2 = new DataSeries("SERIE 2");
	   serie2.add(new DataSeriesItem(0,2));
	   serie2.add(new DataSeriesItem(1,2));
	   serie2.add(new DataSeriesItem(2,3));
	   serie2.add(new DataSeriesItem(3,4));
	   serie2.add(new DataSeriesItem(4,5));
	   conf.addSeries(serie2);
	   PlotOptionsLine serie2Opts = new PlotOptionsLine();
	   serie2Opts.setColor(SolidColor.RED);
	   serie2.setPlotOptions(serie2Opts);

	   return chart;
}
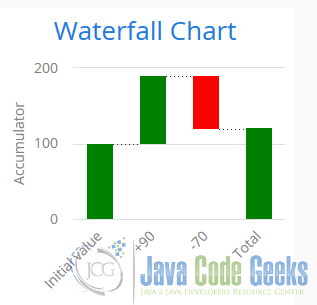
7.3 WaterFall Chart
The waterfall chart help to understand the cumulative effects of positive and negatives values.
Create the chart and assign a fixed size of 300×300 pixels.
Create Chart
	Chart chart = new Chart(ChartType.WATERFALL);
	chart.setWidth("300px");
	chart.setHeight("300px");
Create a Configuration object, set the title and get rid of the legend.
Configuration
	Configuration conf = chart.getConfiguration();
	conf.setTitle("Waterfall Chart");
	conf.getLegend().setEnabled(false);
Define the x axis of the chart and set the categories.
Xaxis
	XAxis xaxis = new XAxis();
	xaxis.setCategories("Initial value", "+90", "-70" , "Total");
	conf.addxAxis(xaxis);
Define a y axis and set the title of the y axis.
Yaxis
	YAxis yaxis = new YAxis();
	yaxis.setTitle("Accumulator");
	conf.addyAxis(yaxis);
Define the colors, green to positive values and red to negative values.
Colors
	final Color negative = SolidColor.RED;
	final Color positive = SolidColor.GREEN;
Create the data of the chart and add it to the configuration.
Data
	DataSeries series = new DataSeries();
	DataSeriesItem start = new DataSeriesItem("Start", 100);
	start.setColor(positive);
	series.add(start);
	DataSeriesItem a90 = new DataSeriesItem("+90", +90);
	a90.setColor(positive);
	series.add(a90);
	DataSeriesItem m70 = new DataSeriesItem("-70", -70);
	m70.setColor(negative);
	series.add(m70);

	WaterFallSum end = new WaterFallSum("Total");
	end.setColor(positive);
	end.setIntermediate(false);
	series.add(end);
	conf.addSeries(series);
The waterfall chart method.
Waterfall Chart
private Chart getWaterfallChart()
{
	Chart chart = new Chart(ChartType.WATERFALL);
	chart.setWidth("300px");
	chart.setHeight("300px");

	Configuration conf = chart.getConfiguration();
	conf.setTitle("Waterfall Chart");
	conf.getLegend().setEnabled(false);

	XAxis xaxis = new XAxis();
	xaxis.setCategories("Initial value", "+90", "-70" , "Total");
	conf.addxAxis(xaxis);

	YAxis yaxis = new YAxis();
	yaxis.setTitle("Accumulator");
	conf.addyAxis(yaxis);

	final Color negative = SolidColor.RED;
	final Color positive = SolidColor.GREEN;

	DataSeries series = new DataSeries();

	DataSeriesItem start = new DataSeriesItem("Start", 100);
	start.setColor(positive);
	series.add(start);

	DataSeriesItem a90 = new DataSeriesItem("+90", +90);
	a90.setColor(positive);
	series.add(a90);

	DataSeriesItem m70 = new DataSeriesItem("-70", -70);
	m70.setColor(negative);
	series.add(m70);

	WaterFallSum end = new WaterFallSum("Total");
	end.setColor(positive);
	end.setIntermediate(false);
	series.add(end);

	conf.addSeries(series);
	return chart;
}
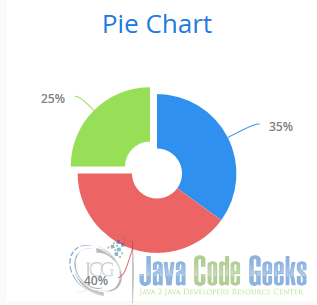
7.4 Pie Chart
A pie chart is used to view and compare numerical proportions.
Create the chart and set its size.
Create chart
	Chart chart = new Chart(ChartType.PIE);
	chart.setWidth("300px");
	chart.setHeight("300px");
Create the configuration.
Configuration
	Configuration conf = chart.getConfiguration();
	conf.setTitle("Pie Chart");
Create the plot options, the size, the center and the inner size.
Plot options
	PlotOptionsPie options = new PlotOptionsPie();
	options.setInnerSize("50px");
	options.setSize("75%");
	options.setCenter("50%", "50%");
	conf.setPlotOptions(options);
Create the data, one of 35%, one of 40% and one of 25% sliced to call the attention of the viewer.

Data
	DataSeries series = new DataSeries();
	series.add(new DataSeriesItem("35%", 35));
	series.add(new DataSeriesItem("40%", 40));
	DataSeriesItem s25 = new DataSeriesItem("25%", 25);
	s25.setSliced(true);
	series.add(s25);
	conf.addSeries(series);
The Pie chart method.
Pie Chart
private Chart getPieChart()
{
	Chart chart = new Chart(ChartType.PIE);
	chart.setWidth("300px");
	chart.setHeight("300px");
	Configuration conf = chart.getConfiguration();
	conf.setTitle("Pie Chart");
	PlotOptionsPie options = new PlotOptionsPie();
	options.setInnerSize("50px");
	options.setSize("75%");
	options.setCenter("50%", "50%");
	conf.setPlotOptions(options);
	DataSeries series = new DataSeries();
	series.add(new DataSeriesItem("35%", 35));
	series.add(new DataSeriesItem("40%", 40));
	DataSeriesItem s25 = new DataSeriesItem("25%", 25);
	s25.setSliced(true);
	series.add(s25);
	conf.addSeries(series);

	return chart;
}
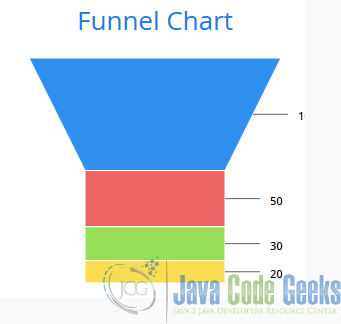
7.5 Funnel Chart
Is used to represent stages on sales process and potential revenue on each state.
Create the chart.
Create
	Chart chart = new Chart(ChartType.FUNNEL);
	chart.setWidth("300px");
	chart.setHeight("300px");
Set the configuration.
Configuration
	Configuration conf = chart.getConfiguration();
	conf.setTitle("Funnel Chart");
	conf.getLegend().setEnabled(false);
Configure the plot options to set the neck of the funnel
Plot options
	PlotOptionsFunnel options = new PlotOptionsFunnel();
	options.setNeckHeight("50%");
	options.setNeckWidth("50%");
	conf.setPlotOptions(options);
Add the data.
Data
	DataSeries series = new DataSeries();
	series.add(new DataSeriesItem("100", 100));
	series.add(new DataSeriesItem("50", 50));
	series.add(new DataSeriesItem("30", 30));
	series.add(new DataSeriesItem("20", 20));
	conf.addSeries(series);
	return chart;
The funnel chart method.
Funnel Chart
private Chart getFunnelChart()
{
	Chart chart = new Chart(ChartType.FUNNEL);
	chart.setWidth("300px");
	chart.setHeight("300px");

	Configuration conf = chart.getConfiguration();
	conf.setTitle("Funnel Chart");
	conf.getLegend().setEnabled(false);

	PlotOptionsFunnel options = new PlotOptionsFunnel();
	options.setNeckHeight("50%");
	options.setNeckWidth("50%");
	conf.setPlotOptions(options);

	DataSeries series = new DataSeries();
	series.add(new DataSeriesItem("100", 100));
	series.add(new DataSeriesItem("50", 50));
	series.add(new DataSeriesItem("30", 30));
	series.add(new DataSeriesItem("20", 20));
	conf.addSeries(series);
	return chart;
}
Create charts with Vaadin is very easy, all the chart share similar properties that make the process very intuitive you can resume the task to create charts into: create the chart, set the configuration, define the plot options and add the data. Some charts have more or less options but the process to create it is very similar.
8. The complete source code
VaadinchartsUI.java
package com.example.vaadincharts;

import javax.servlet.annotation.WebServlet;

import com.vaadin.addon.charts.Chart;
import com.vaadin.addon.charts.model.ChartType;
import com.vaadin.addon.charts.model.Configuration;
import com.vaadin.addon.charts.model.DataSeries;
import com.vaadin.addon.charts.model.DataSeriesItem;
import com.vaadin.addon.charts.model.PlotOptionsFunnel;
import com.vaadin.addon.charts.model.PlotOptionsLine;
import com.vaadin.addon.charts.model.PlotOptionsPie;
import com.vaadin.addon.charts.model.WaterFallSum;
import com.vaadin.addon.charts.model.XAxis;
import com.vaadin.addon.charts.model.YAxis;
import com.vaadin.addon.charts.model.style.Color;
import com.vaadin.addon.charts.model.style.SolidColor;
import com.vaadin.annotations.Theme;
import com.vaadin.annotations.VaadinServletConfiguration;
import com.vaadin.server.VaadinRequest;
import com.vaadin.server.VaadinServlet;
import com.vaadin.ui.HorizontalLayout;
import com.vaadin.ui.UI;
import com.vaadin.ui.VerticalLayout;

@SuppressWarnings("serial")
@Theme("vaadincharts")
public class VaadinchartsUI extends UI {

	@WebServlet(value = "/*", asyncSupported = true)
	@VaadinServletConfiguration(productionMode = false, ui = VaadinchartsUI.class, widgetset = "com.example.vaadincharts.widgetset.VaadinchartsWidgetset")
	public static class Servlet extends VaadinServlet {
	}

	@Override
	protected void init(VaadinRequest request) {
		   final VerticalLayout layout = new VerticalLayout();
		   layout.setMargin(true);
		   setContent(layout);

		   HorizontalLayout line01 = new HorizontalLayout();
		   HorizontalLayout line02 = new HorizontalLayout();

		   line01.addComponent(getLineChart());
		   line01.addComponent(getWaterfallChart());
		   line02.addComponent(getPieChart());
		   line02.addComponent(getFunnelChart());
		   layout.addComponent(line01);
		   layout.addComponent(line02);
	}

private Chart getLineChart()
{
	   Chart chart = new Chart();
	   chart.setWidth("300px");
	   chart.setHeight("300px");
	   Configuration conf = chart.getConfiguration();
	   conf.getChart().setType(ChartType.LINE);
	   conf.setTitle("Line Chart");

	   DataSeries serie1 = new DataSeries("SERIE 1");
	   serie1.add(new DataSeriesItem(0,0));
	   serie1.add(new DataSeriesItem(1,1));
	   serie1.add(new DataSeriesItem(2,2));
	   serie1.add(new DataSeriesItem(3,3));
	   serie1.add(new DataSeriesItem(4,4));
	   conf.addSeries(serie1);
	   PlotOptionsLine serie1Opts = new PlotOptionsLine();
	   serie1Opts.setColor(SolidColor.BLUE);
	   serie1.setPlotOptions(serie1Opts);

	   DataSeries serie2 = new DataSeries("SERIE 2");
	   serie2.add(new DataSeriesItem(0,2));
	   serie2.add(new DataSeriesItem(1,2));
	   serie2.add(new DataSeriesItem(2,3));
	   serie2.add(new DataSeriesItem(3,4));
	   serie2.add(new DataSeriesItem(4,5));
	   conf.addSeries(serie2);
	   PlotOptionsLine serie2Opts = new PlotOptionsLine();
	   serie2Opts.setColor(SolidColor.RED);
	   serie2.setPlotOptions(serie2Opts);

	   return chart;
}

private Chart getWaterfallChart()
{
	Chart chart = new Chart(ChartType.WATERFALL);
	chart.setWidth("300px");
	chart.setHeight("300px");

	Configuration conf = chart.getConfiguration();
	conf.setTitle("Waterfall Chart");
	conf.getLegend().setEnabled(false);

	XAxis xaxis = new XAxis();
	xaxis.setCategories("Initial value", "+90", "-70" , "Total");
	conf.addxAxis(xaxis);

	YAxis yaxis = new YAxis();
	yaxis.setTitle("Accumulator");
	conf.addyAxis(yaxis);
	final Color negative = SolidColor.RED;
	final Color positive = SolidColor.GREEN;

	DataSeries series = new DataSeries();

	DataSeriesItem start = new DataSeriesItem("Start", 100);
	start.setColor(positive);
	series.add(start);

	DataSeriesItem a90 = new DataSeriesItem("+90", +90);
	a90.setColor(positive);
	series.add(a90);

	DataSeriesItem m70 = new DataSeriesItem("-70", -70);
	m70.setColor(negative);
	series.add(m70);

	WaterFallSum end = new WaterFallSum("Total");
	end.setColor(positive);
	end.setIntermediate(false);
	series.add(end);

	conf.addSeries(series);
	return chart;
}

private Chart getPieChart()
{
	Chart chart = new Chart(ChartType.PIE);
	chart.setWidth("300px");
	chart.setHeight("300px");
	Configuration conf = chart.getConfiguration();
	conf.setTitle("Pie Chart");
	PlotOptionsPie options = new PlotOptionsPie();
	options.setInnerSize("50px");
	options.setSize("75%");
	options.setCenter("50%", "50%");
	conf.setPlotOptions(options);
	DataSeries series = new DataSeries();
	series.add(new DataSeriesItem("35%", 35));
	series.add(new DataSeriesItem("40%", 40));
	DataSeriesItem s25 = new DataSeriesItem("25%", 25);
	s25.setSliced(true);
	series.add(s25);
	conf.addSeries(series);

	return chart;
}


private Chart getFunnelChart()
{
	Chart chart = new Chart(ChartType.FUNNEL);
	chart.setWidth("300px");
	chart.setHeight("300px");

	Configuration conf = chart.getConfiguration();
	conf.setTitle("Funnel Chart");
	conf.getLegend().setEnabled(false);

	PlotOptionsFunnel options = new PlotOptionsFunnel();
	options.setNeckHeight("50%");
	options.setNeckWidth("50%");

	conf.setPlotOptions(options);

	DataSeries series = new DataSeries();
	series.add(new DataSeriesItem("100", 100));
	series.add(new DataSeriesItem("50", 50));
	series.add(new DataSeriesItem("30", 30));
	series.add(new DataSeriesItem("20", 20));
	conf.addSeries(series);
	return chart;
}
}
9. Running the example
Right click on the project folder and choose Run as -> Run on server choose Tomcat 8 server and hit finish.
10. Results
When you run the example if ecerything is ok, you should see the following charts on your browser
11. Download the Source Code
This was an example about Vaadin Charts.
You can download the Eclipse project here: VaadinCharts
